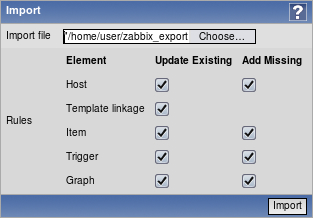
Previously, we installed the Zabbix agent on the same host and monitored a single item for it. It's now time to expand and see how inter-host connectivity works.
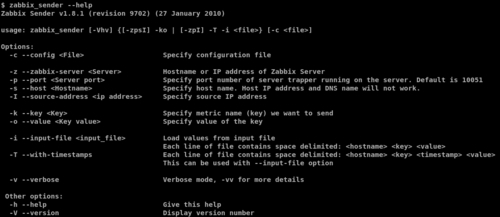
To continue, install the Zabbix agent on another host. Compiling an agent only is done in a similar way to how we compiled everything in the beginning, but instead of the full configure line, you just need a single flag this time:
Configuration should complete successfully and the following summary lines are important:
If the output you see matches the above output, continue by issuing the following command:
Compilation should complete without any errors, and it should do so relatively quickly.
If you install distribution packages, don't worry when the agent daemon has an older version than server. This is supported and should work well. In fact, Zabbix agent daemon version 1.1 works quite well with a 1.8 version server. The other way usually won't work; you should avoid using an older server with new agents.
Staying with an older agent can be more convenient as you already have one installed and working well. When setting up new ones it is suggested to go with the latest one, as it might have bugs fixed, improved performance, more supported items for a particular platform, or other benefits.
We also have to create a configuration file, so, as root, copy example configuration (usually not needed when installing from distribution packages):
With the agent installed, now is the time to start it up. As this is a distribution-specific process, either refer to Chapter 1 for example startup scripts and their usage, or, if you installed from distribution packages, use the startup script supplied with them.
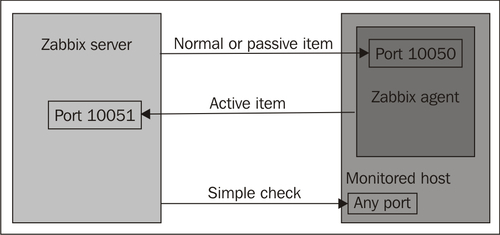
The item we created before was a so called "passive" item, which means that Zabbix server initiates a connection to agent every time configuration specifies it has to be checked. In most locations they are simply referred to as being of type "Zabbix agent". Let's create another passive item to check for the remote host.
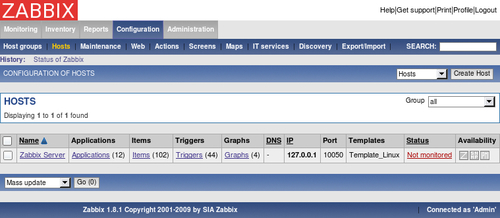
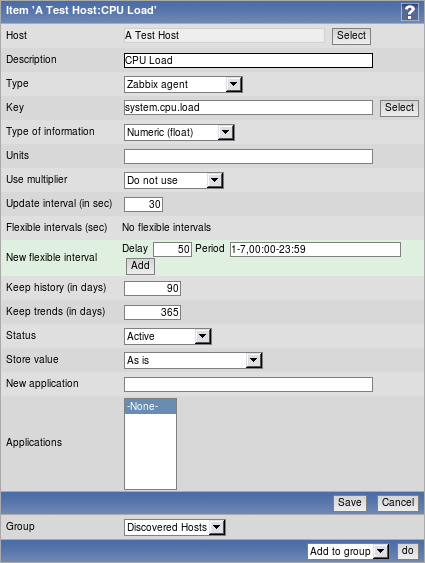
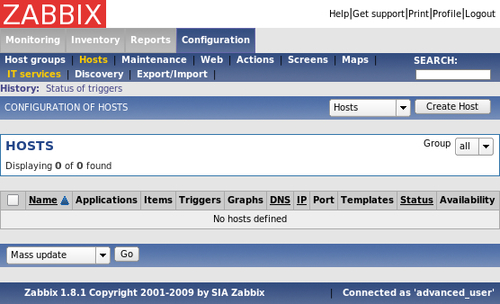
Open Configuration | Hosts, click on Items next to the host you just created then click on Create Item button.
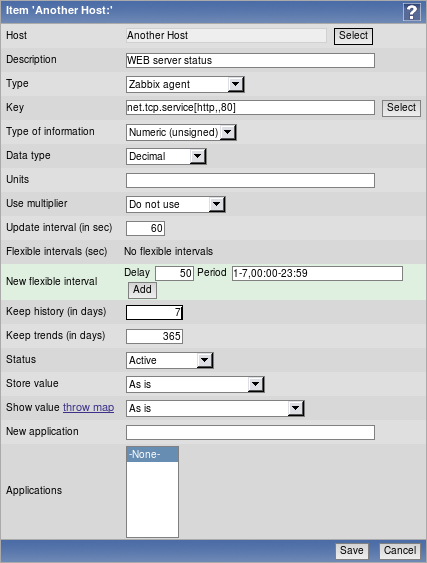
Description: Enter WEB server status
Key: Enter net.tcp.service[http,,80] (that's two subsequent commas preceding 80)
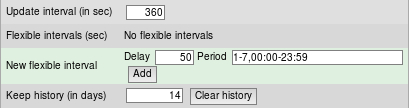
Update interval: Change to 60 from the default (30) once a minute should be more than enough for our needs
Keep history: Change to 7 from the default (90) that's still a whole week of exact minutely service status records kept
The end result should be as follows:
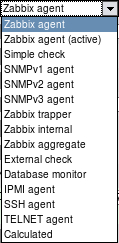
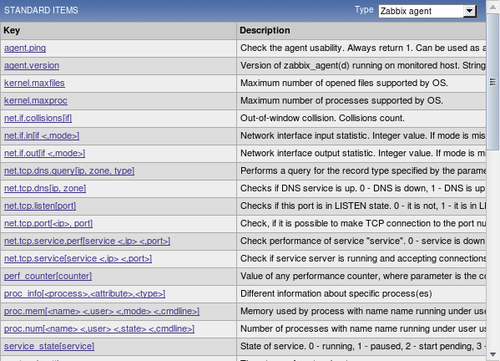
But what's up with that ",,80" added to the service name? Click the Select button next to the Key field. This opens a window with a nice list of keys to choose from, along with a short description of each.
The Type dropdown in the upper-right corner will allow you to switch between several item types; we'll discuss the other types later. For now, find net.tcp.service in the list and look at the description. There are two things to learn here. First, we didn't actually have to add that 80 it's a port, and, given that default already is 80, adding it was redundant. However, it is useful if you have a service running on a non-standard port. Second, there's a key list just one click away to give you quick hint in case you have forgotten a particular key or what its parameters should be like.
This key, net.tcp.service, is a bit special it tries to verify that the corresponding service actually does respond in a standard manner, which means the service must be explicitly supported. As of writing this, Zabbix supports the following services for the net.tcp.service key:
FTP
HTTP
IMAP
LDAP
NNTP
NTP
POP
SMTP
SSH
TCP
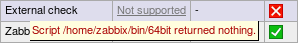
The last service is a bit special in its own way. While others perform service-specific checks, TCP just checks the TCP connection. It's closer to a key you can see a couple of rows above in the itemlist, net.tcp.port. As the description says, this one just tries to open TCP connection to any arbitrary port without performing any service-specific checks on the returned value. If you try to use an arbitrary service string that is not supported, you would simply get an error message saying Not supported by Zabbix agent.
Feel free to look at other available keys we will use a couple of them later as well, then close this pop up and click on Save.
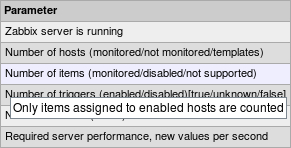
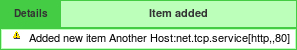
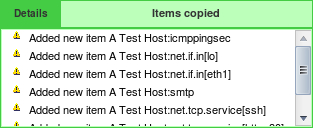
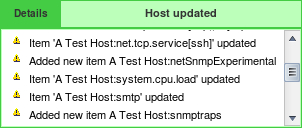
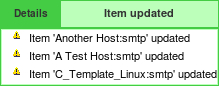
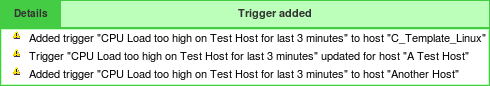
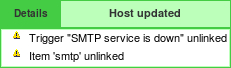
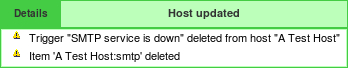
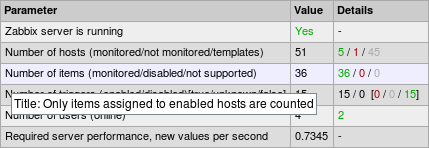
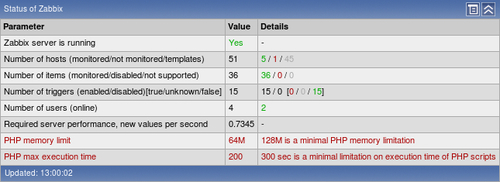
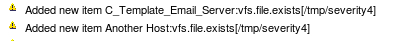
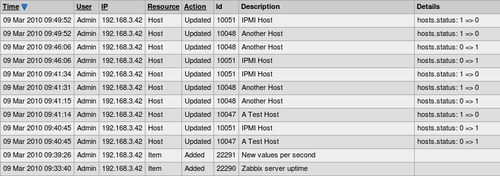
You probably have already noticed the green strip at the top of the screen when some operation successfully completes. This time there's also control Details available, so click on it to expand details.
You can click on Details again to collapse contents. Of course, this can be done whenever Details link is available after some operation.
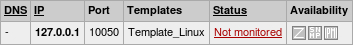
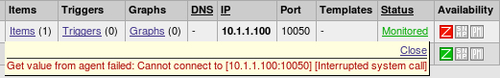
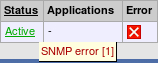
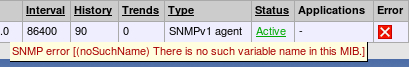
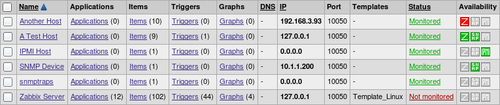
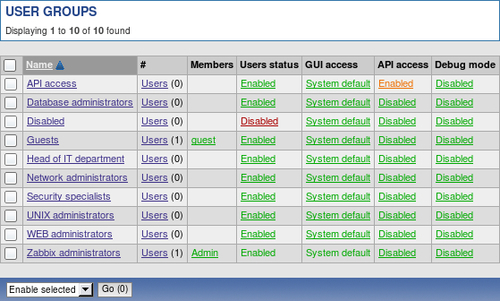
Now, we could go over to Monitoring | Latest data and wait for the values appearing there but that would be useless. Instead, after a couple of minutes you should visit Configuration | Hosts. Depending on your network configuration, you might see a red icon with the letter Z in it. This icon represents errors that have happened when attempting to gather data from the Zabbix agent.
To see the actual error message, move your mouse cursor over the icon, and a tooltip will open. Clicking the error icon will make the tooltip permanent and allow you to copy the error message
Note
The two other icons represent SNMP and IPMI data gathering errors. We will monitor SNMP and IPMI devices later.
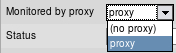
If you see an error message similar to Get value from agent failed: Cannot connect to [10.1.1.100:10050] [Interrupted system call] (most likely, with a different IP address), it means that Zabbix server was unable to connect to agent daemon port. This can happen because of a variety of reasons, the most common being a firewall either a network one in between Zabbix server and the remote host, or a local one on the remote host. Make sure to allow connections from Zabbix server to the monitored machine on port 10050. Then mark the checkbox in the host list next to the remote host, choose Activate selected from the dropdown below the item list, then click Go button and confirm the pop up. While Zabbix will retry connecting to unavailable hosts, this will speedup the reconnection attempt. Alternatively, you can click on the Monitored text in the Status column, which will turn into Not monitored, click on that again. Clicking on Status column values toggles host monitoring.
If you did this correctly (or if you did not have firewall blocking the connection), you could again go to Monitoring | Latest data, only that would be pointless, again. To see why, refresh the host list. Soon, you should see the Zabbix agent status icon turn red again; and moving your mouse cursor over it will reveal another error message, Got empty string from [10.1.1.100]. Assuming that agent dropped connection because of access permissions. Now that's different. What access permissions is it talking about, why did it work for our first host?
From Zabbix server, execute:
Note
You should always verify network connectivity and access permissions from the Zabbix server. Doing that from another machine can have wildly differing and useless results.
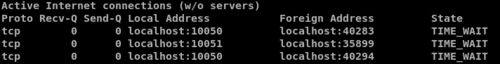
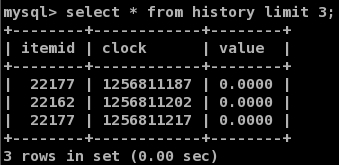
Replace the IP address with the one of your remote host. You should see the following output, and the connection should be immediately closed:
Now, try the same with localhost.
Notice how this time the connection is not closed, so there's a difference in configuration. To close the connection, press Ctrl+], as instructed, then enter quit.
It turns out that configuring the Zabbix agent daemon on another machine is going to be a tiny bit harder than before.
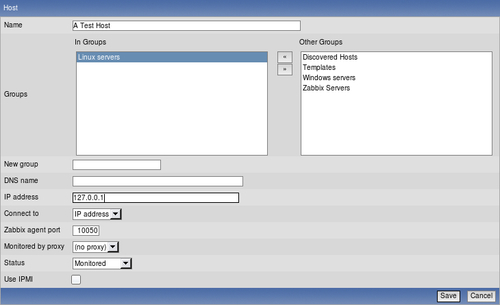
As opposed to the installation on the Zabbix server, we have to edit the agent daemon configuration file on the remote machine. Open /etc/zabbix/zabbix_agentd.conf as root in your favorite editor and take a look at Server parameter. It is currently set to 127.0.0.1, which is the reason we didn't have to touch it on the Zabbix server. As the comment states, this parameter should contain Zabbix server IP address, so replace 127.0.0.1 with the correct server address here. Save the file and restart the agent daemon. To verify the change, try telnetting to the remote machine again.
This time, the outcome should be the same as we had with localhost, so close the connection the same way.
Note
The port, specified in host properties, is used for passive Zabbix agent checks only. If such items are not configured, this port is simply ignored.
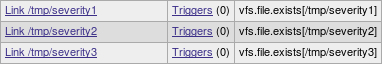
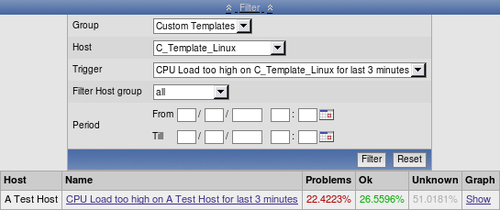
To speed up refreshing of our problematic item, open Configuration | Hosts, click on Items next to Another Host, and reactivate it just like we did with the host before either by marking the checkbox and choosing Activate selected, or by clicking on Status column control.
You can verify that this has worked by refreshing the item list after few seconds.
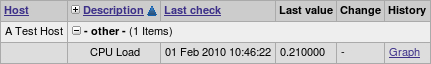
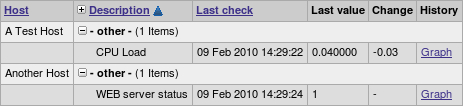
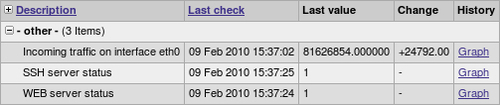
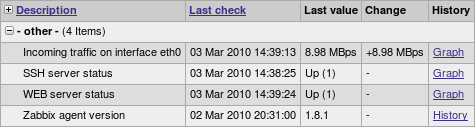
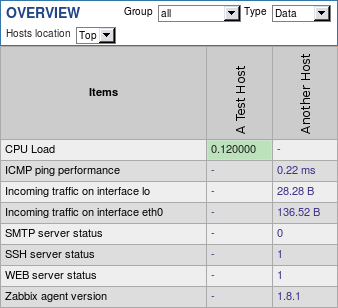
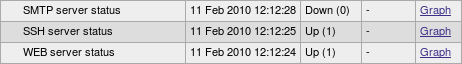
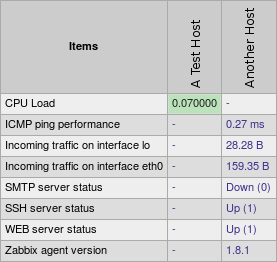
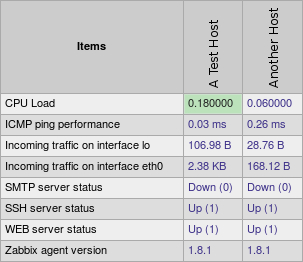
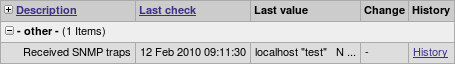
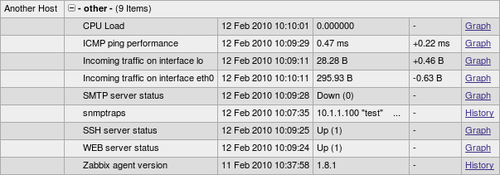
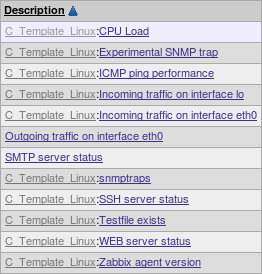
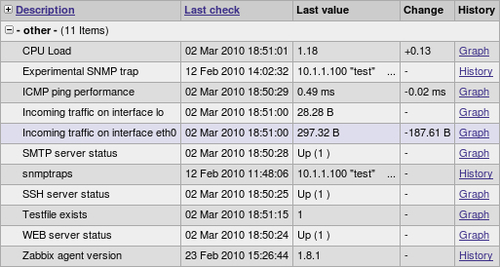
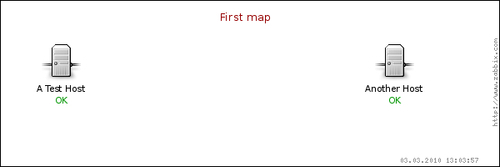
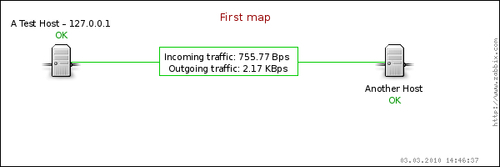
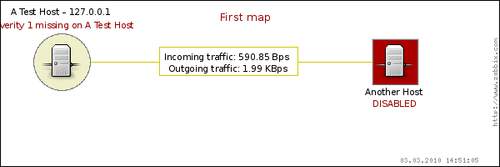
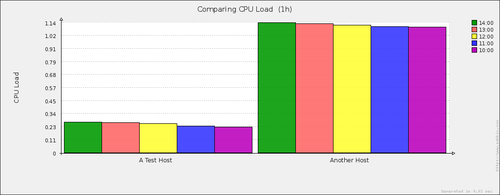
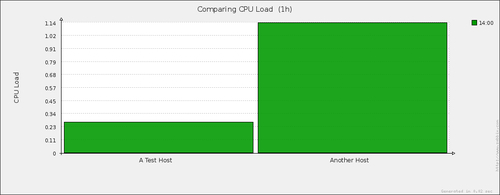
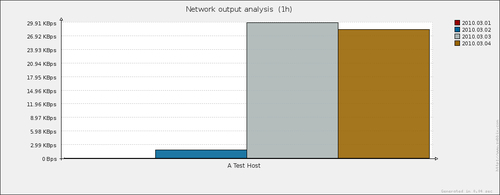
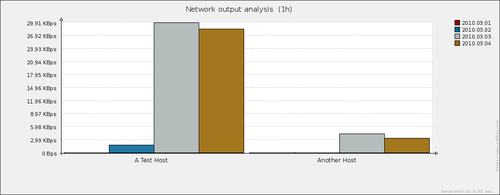
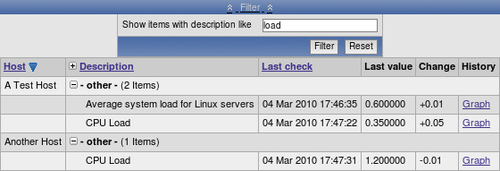
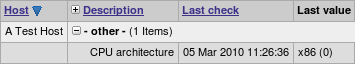
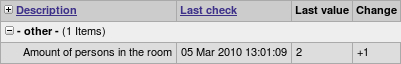
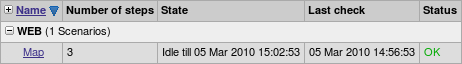
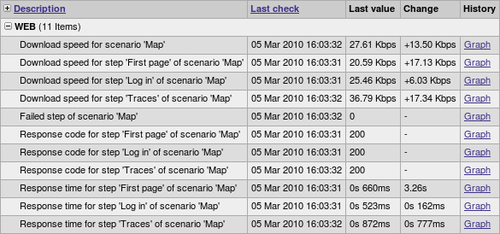
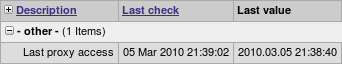
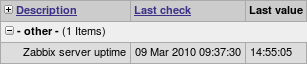
Finally, it should be worth opening Monitoring | Latest data, where we should see two monitored hosts now, each having a single item click on the + icon to expand the newly added item.
By the way, did you notice the + icon in the table heading, next to the Description heading? That one can be used to expand and collapse all entries.
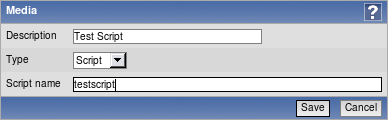
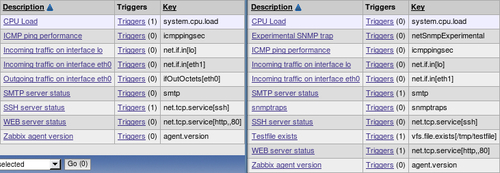
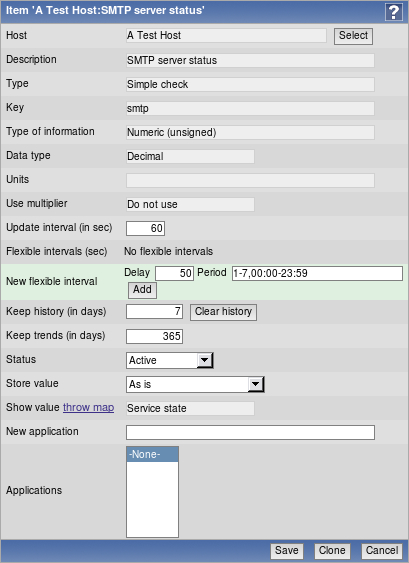
Let's try to monitor another service now; for example, the one running on port 22, SSH. To keep things simple for us, we won't create an item from scratch instead, go back to Configuration | Hosts, click on Items next to Another Host and click on link WEB server status in the Description column. This will open item editing screen, showing all the values we entered before. Notice how this time there are more buttons available at the bottom. Along with the Save and Cancel buttons we also have Delete, which obviously, deletes the currently open item. We don't want to do that now. Instead, click Clone.
Notice how the opened form proposes to create new item, but this time all values are set to what the original item we cloned had. Click Save but that should fail. Remember, we talked about the key being unique per host, that's what the error message says as well.
The item editing form is still open, so we can correct our mistake. Do the following modifications:
Description: Change it to "SSH server status"
Key: Change http,,80 to ssh, so that it looks like this : net.tcp.service[ssh]
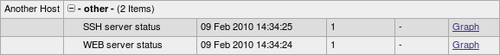
That's all we have to do this time, so click Save again. This time, item should be added successfully. Now navigate to Monitoring | Latest data, where Another Host should have two items listed, SSH server status and WEB server status. Their status would depend on what services are running on the remote host. As it's remote, SSH most likely is running (and thus having a value of 1), but whether or not the web server is running would be specific to your situation.
Note
Monitoring a port is often done to make sure the service on it is available, but that is not a strict requirement. If some system is not supposed to have SSH available from internet, we could use such a check to verify that it has not been accidentally exposed either by inadvertent starting of the SSH daemon or an unfortunate change in the firewall.
This covers the basics of normal, or passive, Zabbix items where the server queries agents, so let's move to other item types.
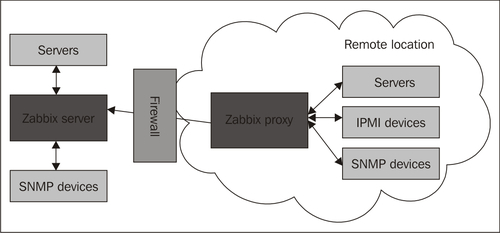
Passive Zabbix items are fine if you can connect to all the monitored hosts from the Zabbix server but what if you can't allow incoming connections to the monitored hosts because of security reasons, or you have to deal with a daft firewall admin?
This is where active items come into play. As opposed to passive items, for active items it's the agent that connects to the server, and the server never connects to the agent. When connecting, the agent downloads a list of items to check, then reports to the new data server periodically. Let's create an active item, but this time we'll try to use some help when selecting item key.
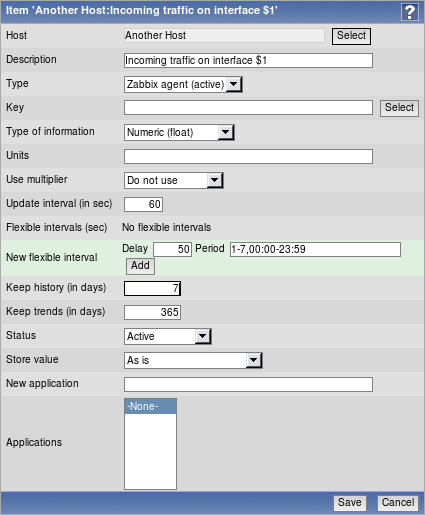
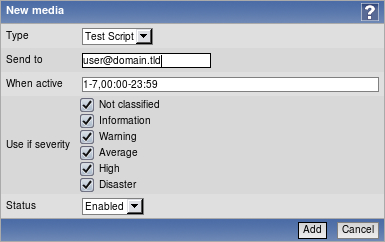
Open Configuration | Hosts, click on Items next to Another Host and click Create Item. For now, fill in these values:
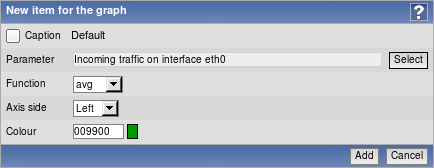
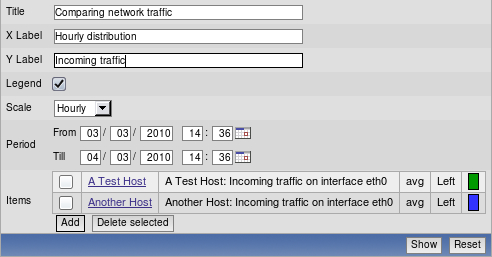
Description: Enter Incoming traffic on interface $1
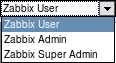
Type: Select Zabbix agent (active)
Type of information: Choose Numeric (float)
Update interval: Enter 60
Keep history: Enter 7
We'll do something different with the Key field, click on Select and in the upcoming dialog that we already saw before, click on net.if.in[if <,mode>]. This will fill in the chosen string.
Replace the content in the square brackets with eth0, so that the field contents read net.if.in[eth0]. When done, click Save.
Open Monitoring | Latest data and check whether new values have arrived.
Well, doesn't look like it. You could wait a bit to be completely sure, but, most likely, no data will appear for this new active item. Which means we're in for another troubleshooting session.
First we should test basic network connectivity. Remember, active agents connect to the server, so we have to know which port they use (by default, it's port 10051). So let's start by testing from the remote monitored machine that it can connect to the Zabbix server:
This should produce output similar to the following:
As before, press Ctrl+] and enter in the resulting prompt:
Such a sequence indicates that the network connection is working properly. If it didn't, verify possible network configuration issues, including network firewalls and local firewall on the Zabbix server. Make sure to allow incoming connections on port 10051.
Note
Both agent and server ports for Zabbix are registered with the Internet Assigned Numbers Authority.
So there might be something wrong with the agent, let's take a closer look. On the remote machine, open the configuration file /etc/zabbix/zabbix_agentd.conf and make sure that configuration option DisableActive is either commented out, or set to 0 (it should be commented out by default).
Note
While you have the configuration file open, notice another parameter just below DisablePassive. As the name indicates, this parameter will prevent the agent from listening on incoming connections from the server, so you can customize your agents to support either one or both of the methods. Disabling both won't work; the agent daemon will complain and refuse to start up and it's correct, starting with both disabled would be a pointless thing to do.
As the DisableActive directive is not set, we could try to look at the agent daemon's log file, so find configuration parameter LogFile by default, it should be set to log to a file /tmp/zabbix_agentd.log. Open this logfile and look for any interesting messages regarding active checks. Each line will be prefixed with a PID and timestamp in the syntax PID:YYYYMMDD:HHMMSS. You'll probably see lines similar to these:
It looks like agent is requesting active check list, but nothing happens after that. Probably something is misconfigured, but this log file entry doesn't help much. Let's try to make agent more verbose again, open /etc/zabbix/zabbix_agentd.conf. This time, look for the parameter named DebugLevel and set it to 4 (as comment warns, that's debugging level and will produce quite a lot of output). Save and close configuration file, then restart Zabbix agent daemon. Take a look at the log file /tmp/zabbix_agentd.log again you should be able to find log entries similar to these:
Now that's a bit more verbose agent is requesting active check list, but receives back nothing. Wait, but it's identifying itself as Zabbix Server, which can't be right. Edit /etc/zabbix/zabbix_agentd.conf and set DebugLevel back to 3, otherwise logfile will be filled with lots of debugging messages.
Take a look a bit lower in the configuration file there's parameter, named Hostname, which currently reads Zabbix Server. Given that comment for this parameter says "Unique hostname. Required for active checks.", it has to be what we're after. Change it to Another Host, save and close configuration file, then restart the Zabbix agent daemon. Check for new entries at /tmp/zabbix_agentd.log there should be no more errors.
If there still are errors about host not found on the server, double check that hostname in Zabbix frontend host properties and agent daemon configuration file (the one just changed) match.
Note
This host name is case sensitive.
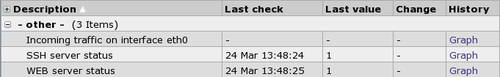
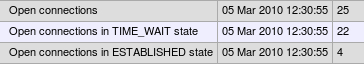
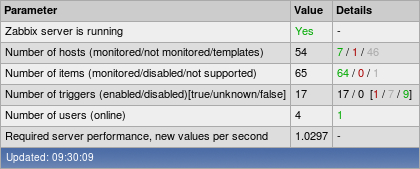
It's now time to return to the frontend and see whether data has started flowing in at Monitoring | Latest data section.
Note
If you see no data and item turns unsupported in the configuration section, check network interface name used on your system you can do that by running /sbin/ifconfig. On some systems network interface can be eth1 or similar if so, use that interface name from now on.
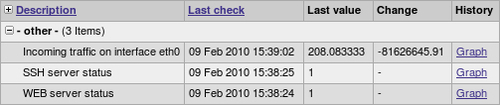
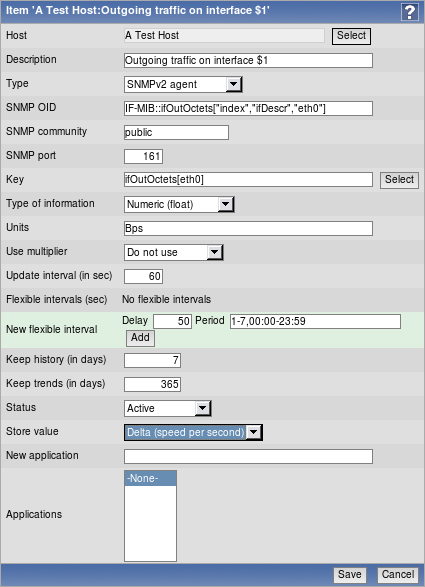
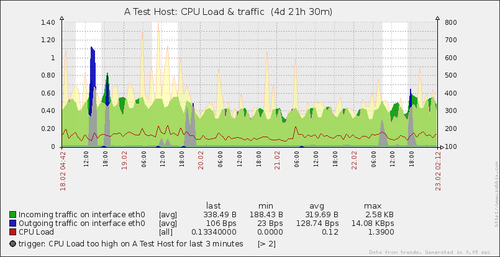
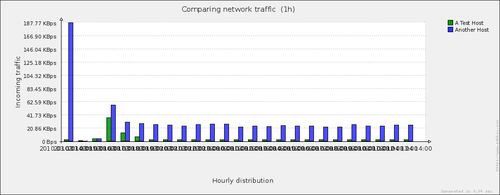
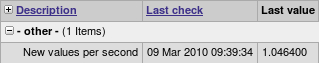
Great, it indeed is but the values look really weird. If you wait for a while, you'll see how the number in Last check column just keeps on increasing. So what is it? Well, network traffic keys gather data from interface counters that is, the network interface adds up all traffic, and this total data is fed into Zabbix database. This has one great advantage even when data is polled at large intervals, traffic spikes would not go unnoticed as the counter data is there but it also makes data pretty much unreadable for us, and graphs would also look like an ever-increasing line (if you feel like it, click on Graph link for this item). Luckily, Zabbix provides a built-in capability to deal with data counters like this. Open Configuration | Hosts, then click on Items next to Another Host and click on Incoming traffic on interface eth0 in the Description column. Change the Store value dropdown to read Delta (speed per second), then click Save.
Check out Monitoring | Latest data again.
Note
Keep in mind that configuration changes might take up to three minutes in the worst case to propagate to Zabbix agent one minute to get into server cache, and two minutes until agent would refresh its own item list.
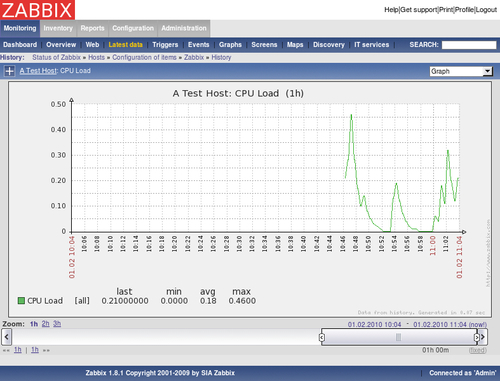
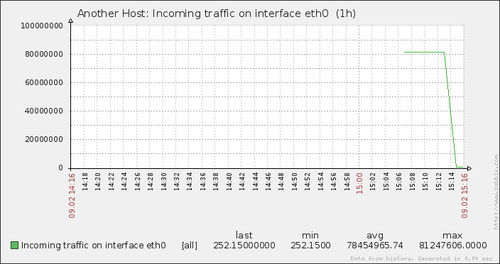
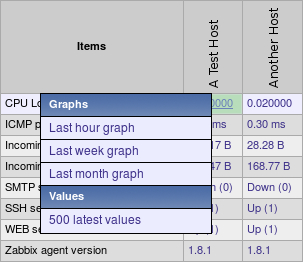
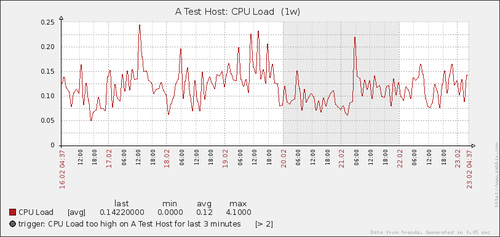
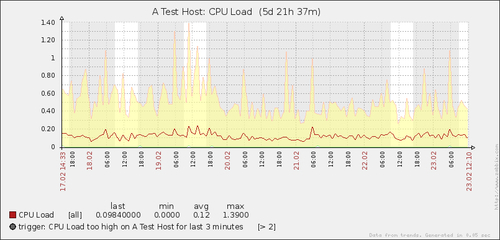
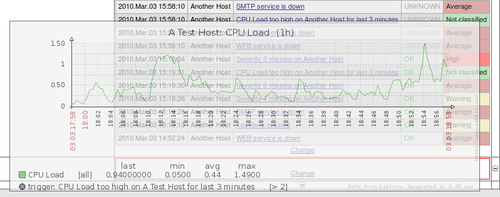
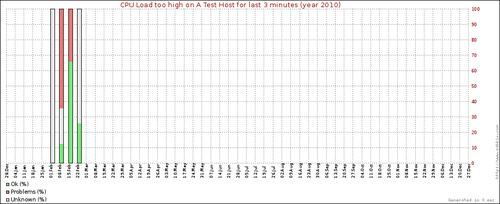
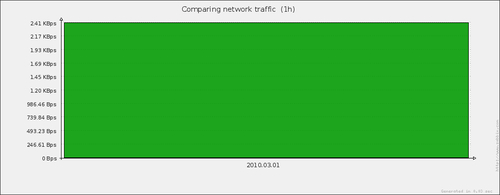
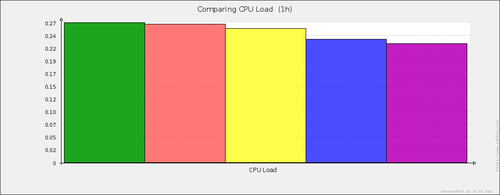
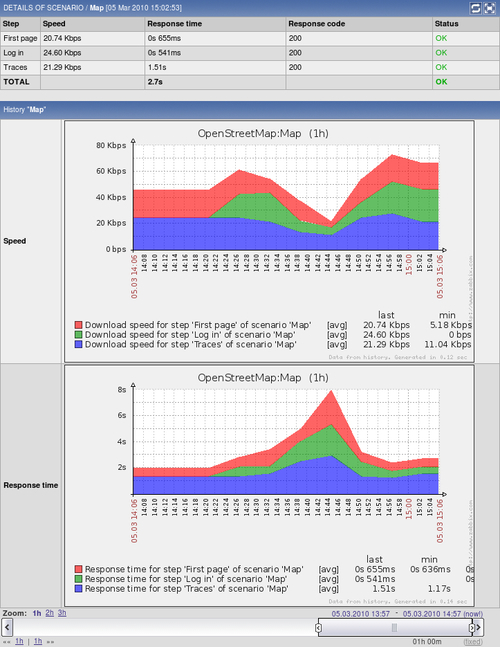
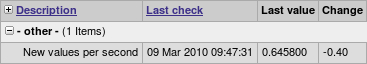
That's better, Zabbix now automatically calculates the change between every two checks (that's what delta is for) and stores that, but the values still don't seem to be too user friendly. Maybe they're better in the graph let's click on the Graph link to find out.
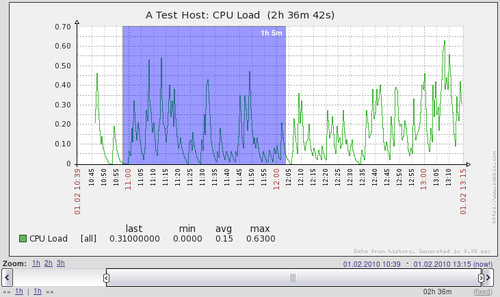
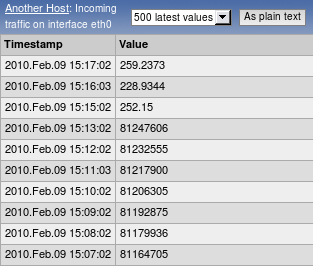
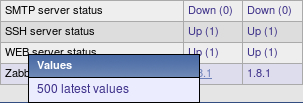
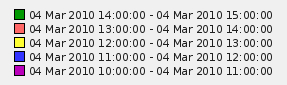
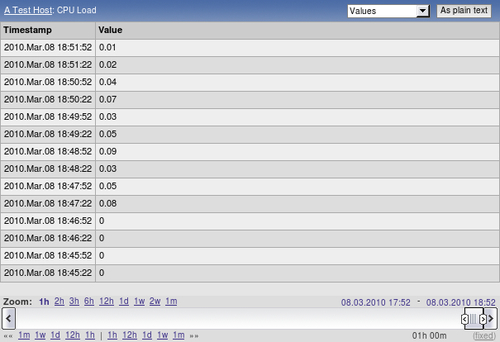
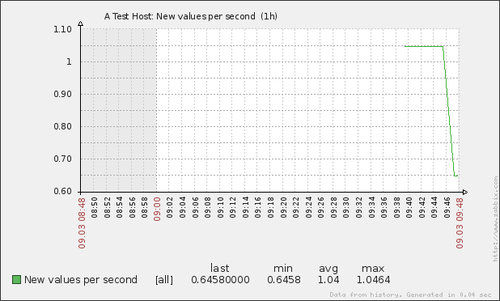
Ouch. While we can clearly see the effect our change had, it also has left us with a very ugly historical data. The upper part of that graph represents total counter (thus showing total since the monitored system was started up), but the lower part represents correct (delta) data. You can also take a look at values numerically - see the dropdown at the upper-right corner, which reads Graph currently. Choose 500 latest values in there.
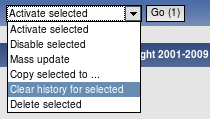
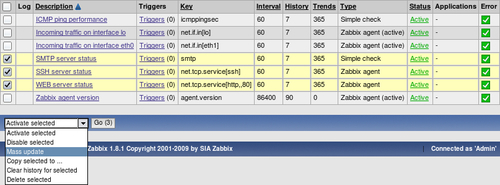
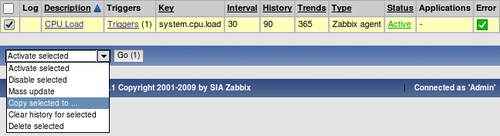
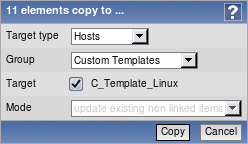
In this list, we can nicely see the change in data representation, as well as the exact time when the change was performed. But those huge values have come from the counter data, and they pollute our nice, clean graph by being so much out of scale we have to get rid of them. Open Configuration | Hosts and click on Items next to Another Host, then mark the checkbox next to Incoming traffic on interface eth0 item and look at the activity dropdown positioned at the bottom of the itemlist.
The second entry from the bottom; named Clear history for selected probably does what we want, so select it. Notice the Go button next to the activity selection it shows the amount of entries selected, so we always know on how many elements we are operating on. Click this button. You should get a JavaScript pop up, asking for confirmation to continue. While history cleaning can take a long time with large datasets, in our case, it should be nearly instant, so click the OK button to continue. This should get rid of all history values for this item, including the huge ones.
Still, looking at the y-axis in that graph, we see those large values that are hard to grasp easily. It would be so much better if Zabbix knew how to calculate it in bytes or similar units. Right, so navigate to Configuration | Hosts and click Items next to Another Host, then click Incoming traffic on interface eth0 in the Description column. Edit the Units field and enter "B", then click Save.
Let's see whether there's any improvement in Monitoring | Latest data.
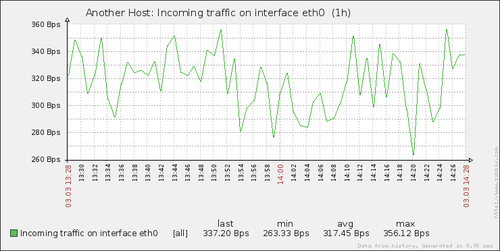
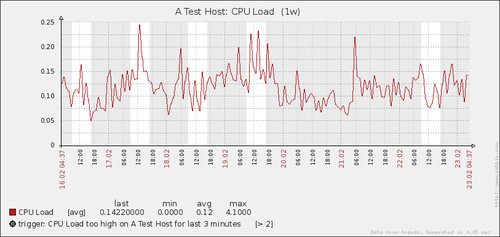
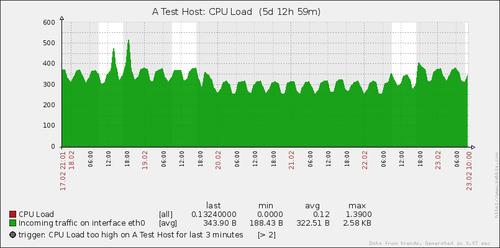
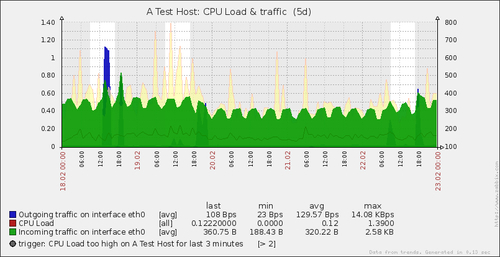
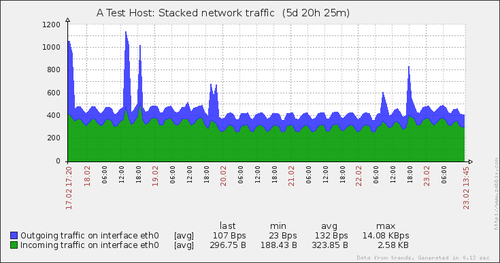
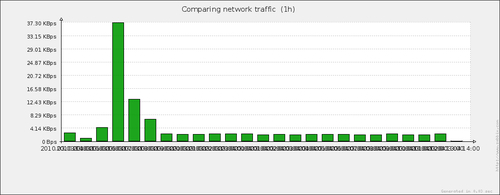
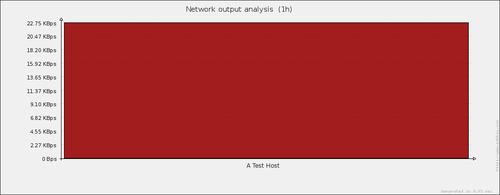
Wonderful, data is still arriving. Even better, notice how Zabbix now automatically calculates MB where appropriate. Let's look at the network traffic, click Graph.
Take a look at y-axis now units are calculated there as well to make the graph readable, and unit calculations are retroactively applied to the previously gathered values.
One parameter that we set, update interval, could have been smaller, thus resulting in a better looking graph. But it is important to remember that the smaller the intervals you have on your items, the more data Zabbix has to retrieve, and each second more and more data has to be inserted into the database and more calculations have to be performed when displaying this data. While it would have made no notable difference on our test system, you should try to keep intervals as large as possible.
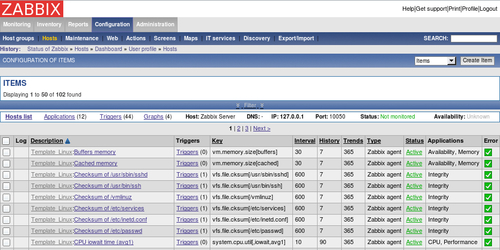
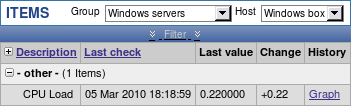
So far we have created items that gathered numeric data either integers, or decimal. Let's create another one, a bit different this time. As usual, open Configuration | Hosts and click on Items next to Another Host. Before continuing with item creation, let's look at what helpful things are available in configuration section, particularly for items. If we look above the item list, we can see navigation and information bar.
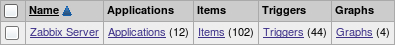
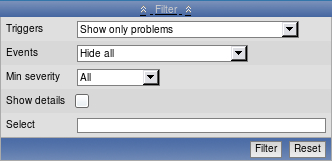
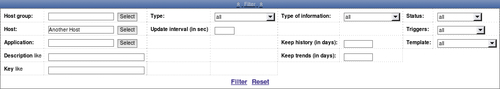
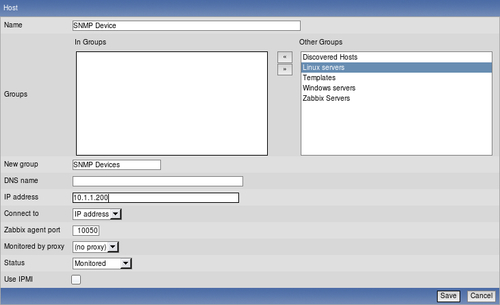
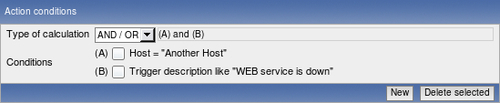
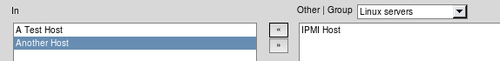
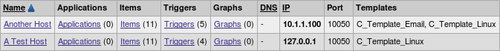
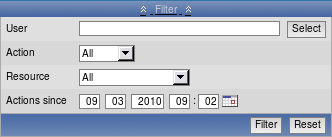
This area provides quick useful information about currently selected host hostname, DNS, IP, configured Zabbix agent port and whether the host is monitored and available. What's even more important, on the left hand side it provides quick shortcuts back to the host list and other elements, associated with current host applications, triggers and graphs. This is a handy way to switch between element categories for a single host without going through the host list all the time. But that's not all yet click on Filter link just above this status bar. A sophisticated filter appears.
Using this filter, we can make complex rules on what items to display. Looking at the left top corner of the filter, we can see that we are not limited to viewing items from a single host we can also choose a hostgroup. When needed, we would make filter choices and click on the Filter link below. Currently it has only one condition field Host contains Another Host, so Items link from the host list we used was the one which set this filter.
Note
Host information and quicklink bar is only available when items are filtered for a single host.
Now look right below the main item filter that is subfilter, which, as its header informs, only affects data already filtered by the main filter.
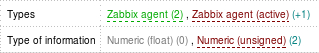
The entries in the subfilter work like toggles if we switch one on, it works as a filter on the data in addition to all other toggled subfilter controls. Let's click on Zabbix agent now. Notice how item list now contains two items only that's what number 2 represented next to this subfilter toggle. But the subfilter itself now also looks different.
The option we enabled, Zabbix agent, is painted in green. Numeric (float), instead, is grey this means that activating this toggle in addition to already active ones would result in no items displayed at all. While Numeric (unsigned) toggle still has 2 listed to it which shows that enabling it will change amount of items displayed to this value Zabbix agent (active) toggle instead has +1 next to it. This form represents the fact that activating this toggle will display one more item than currently, and is used for toggles in the same category, listed on the left. Currently subfilter has few entries, as it only shows present values. Once we will have additional and more different items configured, subfilter will expand. We have finished with exploring these filters, co click on Create Item.
Once you have many different hosts monitored by Zabbix, it's quite easy to forget what version of Zabbix agent daemon each host has and even if you have automated software deploying in place, it is nice to be able to see at which version each host is, all in one place.
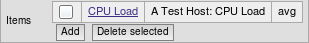
Enter the following values:
Description: Enter Zabbix agent version
Type: Select Zabbix agent (active) (we're still creating active items);
Key: Click on Select, then choose second entry from the list agent.version
Type of information: Choose Character
Update interval: Enter 86400
When done, click the Save button.
There are two notable things we did. First, we set information type to Character, which reloaded the form, slightly changing available options. Most notably, fields that are relevant for numeric information were hidden, such as units, multiplier, and trends.
Second, we entered a very large update interval, 86400, which is equivalent to 24 hours. While that might seem excessive, remember what we will be monitoring here Zabbix agent version, so it probably (hopefully) isn't changing several times per day. Depending on your needs, you might set it to even larger values, like a week.
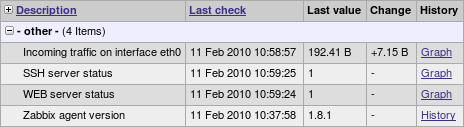
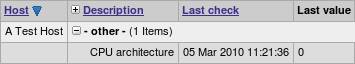
To check out results of our work, open Monitoring | Latest data.
If you don't see the data, wait a while, it should appear eventually. When it does, you should see the version of the Zabbix agent installed on the remote machine listed and it might be a higher number than displayed here, as new versions of Zabbix have probably been released. Notice one minor difference while all the items we added previously have links named Graph in the History column, the last one has History. The reason is simple, for textual items graphs can't be drawn so Zabbix does not even attempt to do that.
Now, about that waiting why did we have to wait for the data to appear? Well, remember how active items work? The agent queries the server for the item list it should report on, then sends in data periodically, but this item list checking is also done periodically. To find out how often, open configuration file /etc/zabbix/zabbix_agentd.conf on the remote machine and look for the parameter RefreshActiveChecks. The comment says that the default is two minutes, which is configured in seconds, thus listing 120 seconds. So in the worst case you might have had to wait for nearly three minutes to see any data, as opposed to normal or passive items, where the server would query the agent as soon as the configuration change is available in its cache. In a production environment with many agents using active items it might be a good idea to increase this value. Usually item parameters aren't changed that often.