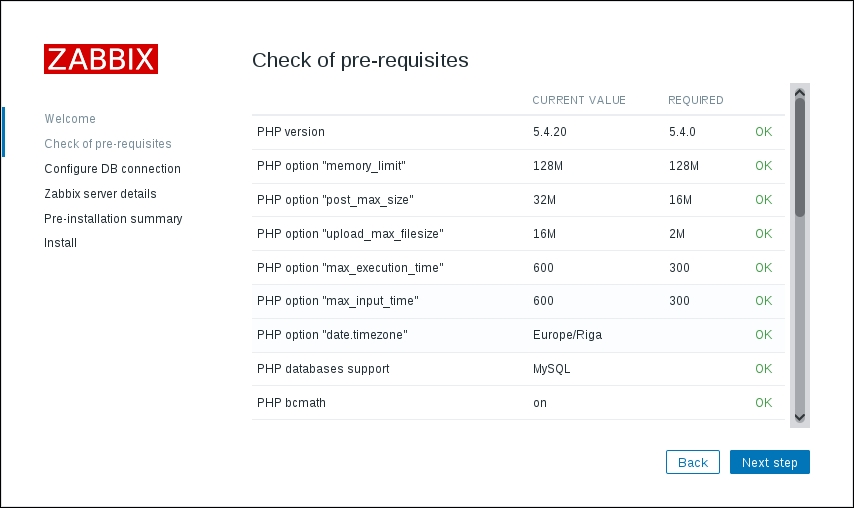
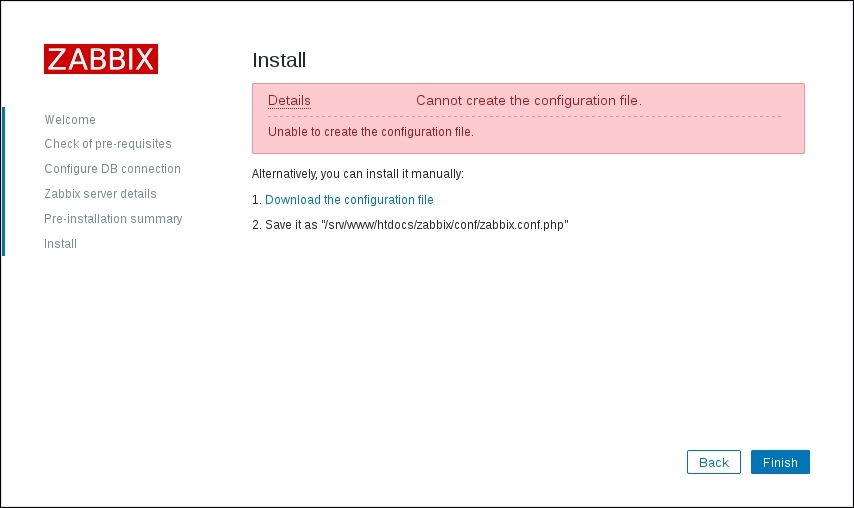
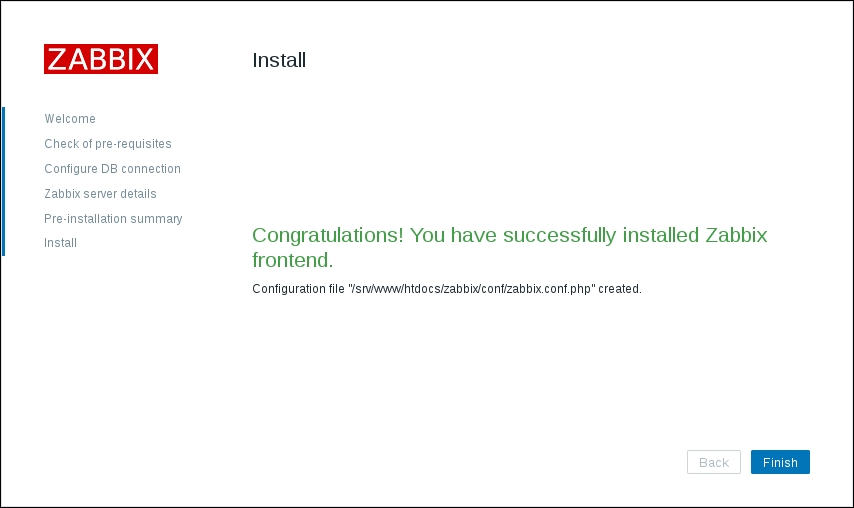
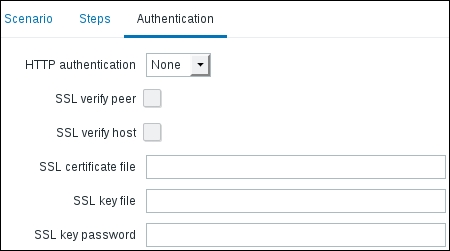
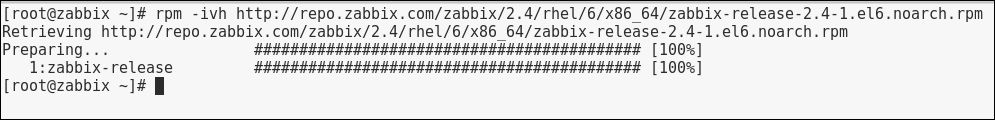
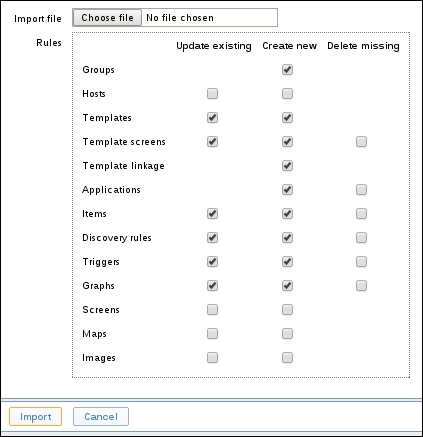
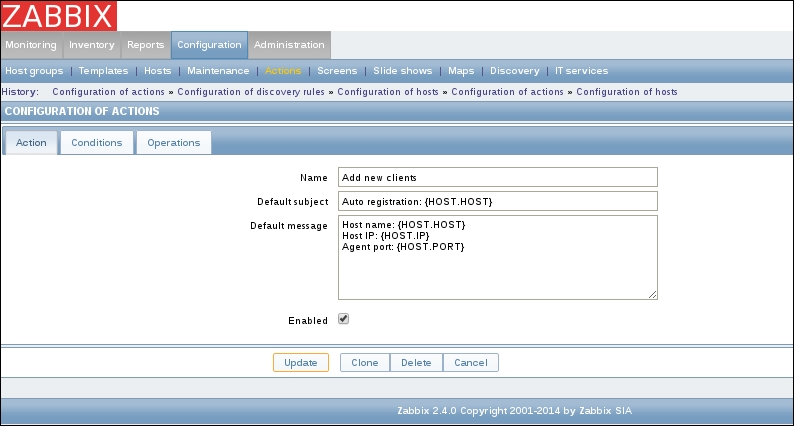
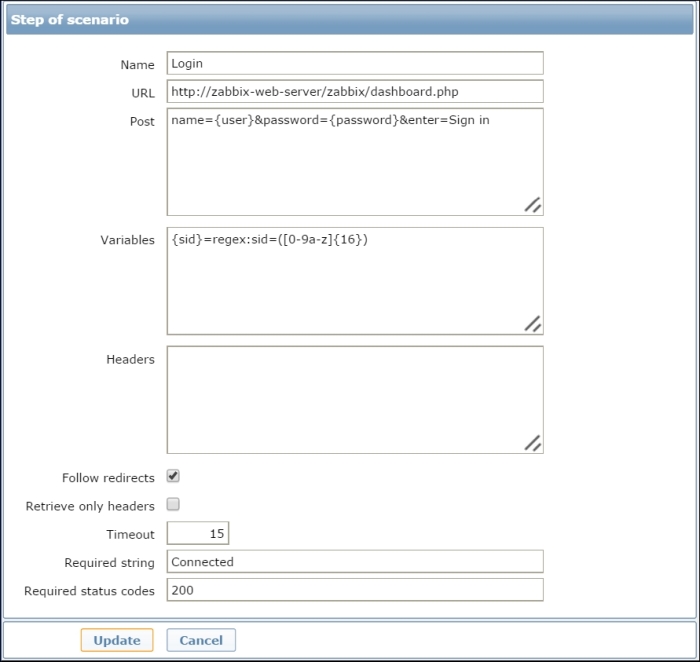
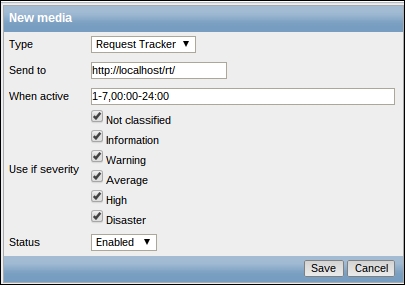
To continue, install the Zabbix agent on another host. The easiest way might be installing from the distribution packages—or you may choose to compile it from the source. If installing from the packages on RHEL/SUSE-based systems, refer to Chapter 1, Getting Started with Zabbix, for repository instructions. Potential agent package names could be:
Compiling the agent only from the source is done in a similar way to how all components were included for compilation in Chapter 1, Getting Started with Zabbix. Instead of the full configure line, we will use a single flag this time:
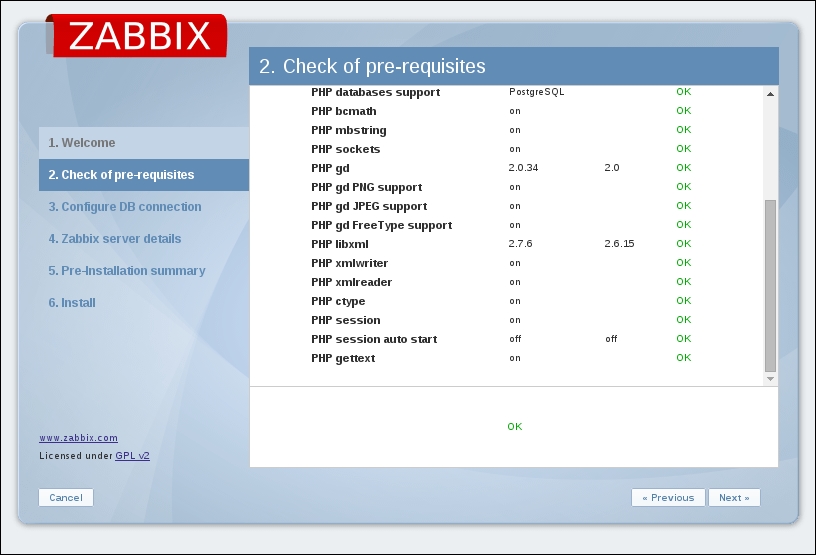
Configuration should complete successfully, and the following summary lines are important:
If the output you see matches the preceding output, continue by issuing the following command:
Compilation should complete without any errors, and it should do so relatively quickly.
With the agent installed, now is the time to start it up. How exactly this is done depends on the installation method—and if you installed from the packages, it depends on the distribution as well. For examples on how to start up the agent, refer to Chapter 1, Getting Started with Zabbix. As a quick reminder, if you installed from packages on an RHEL/SUSE-based system, the agent daemon can likely be started up like this:
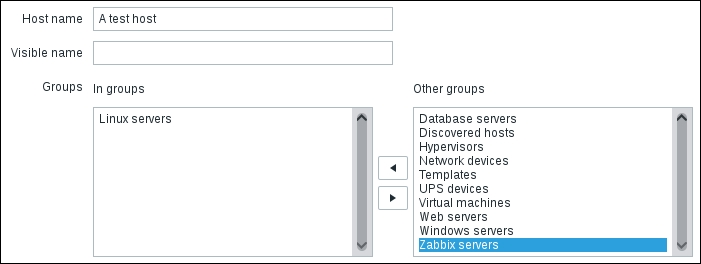
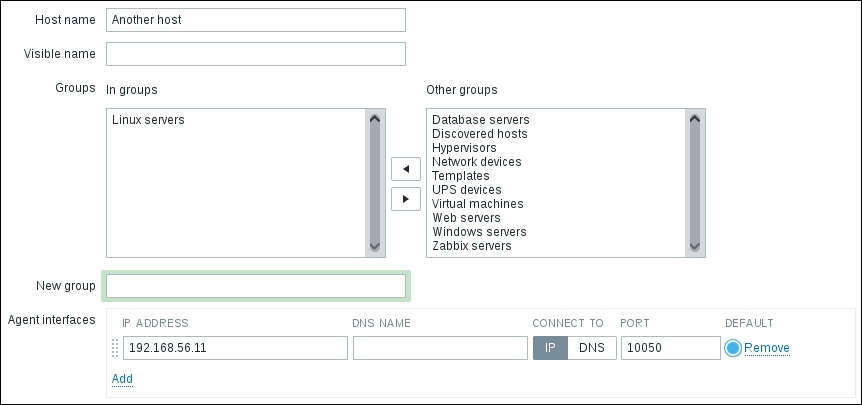
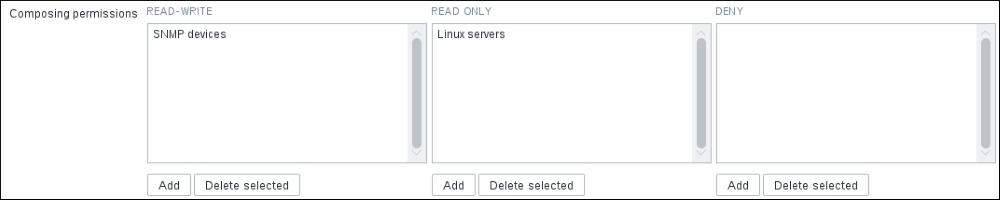
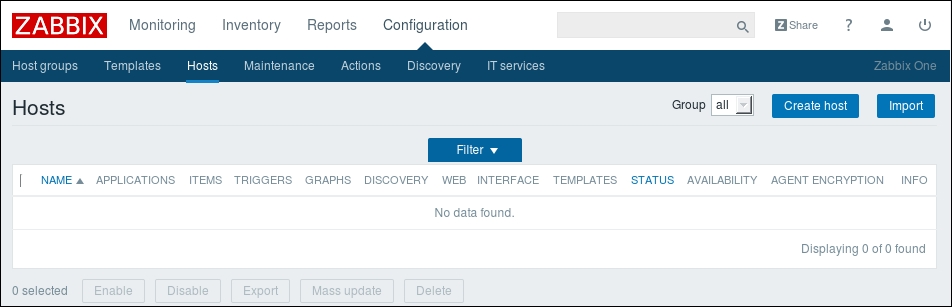
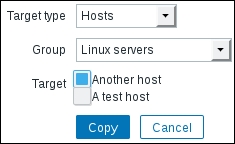
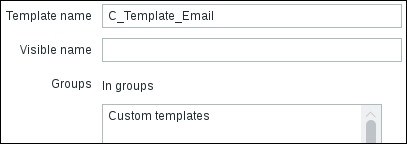
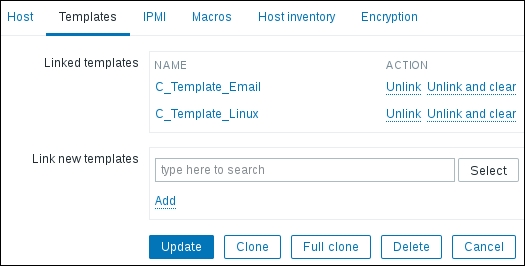
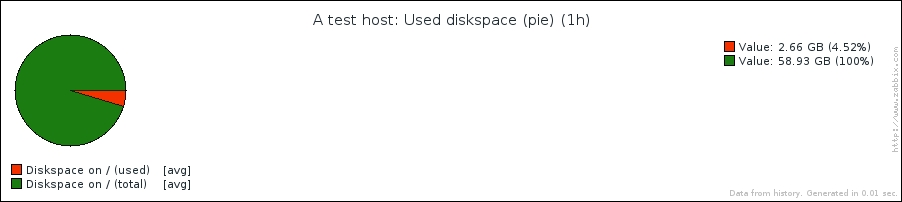
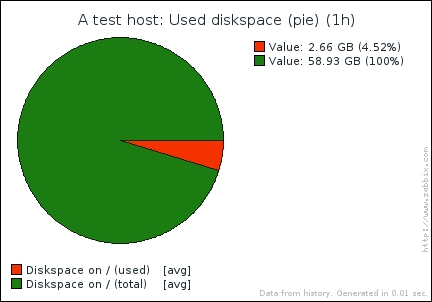
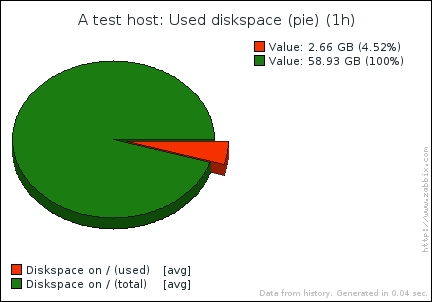
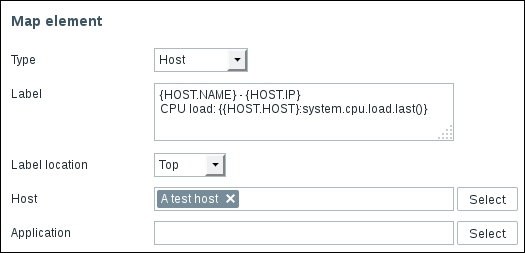
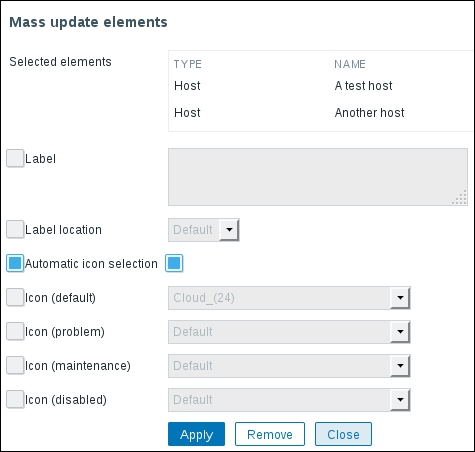
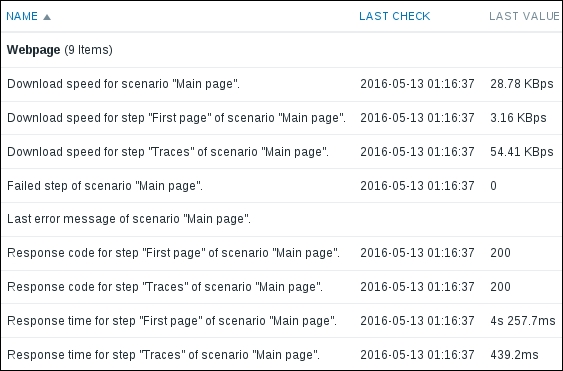
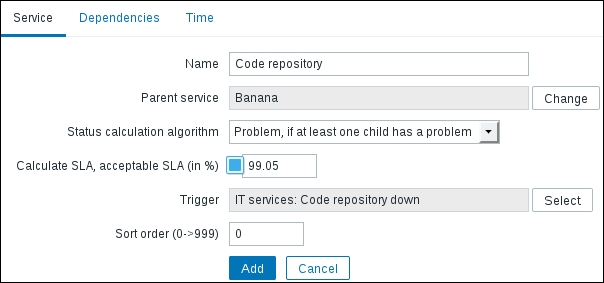
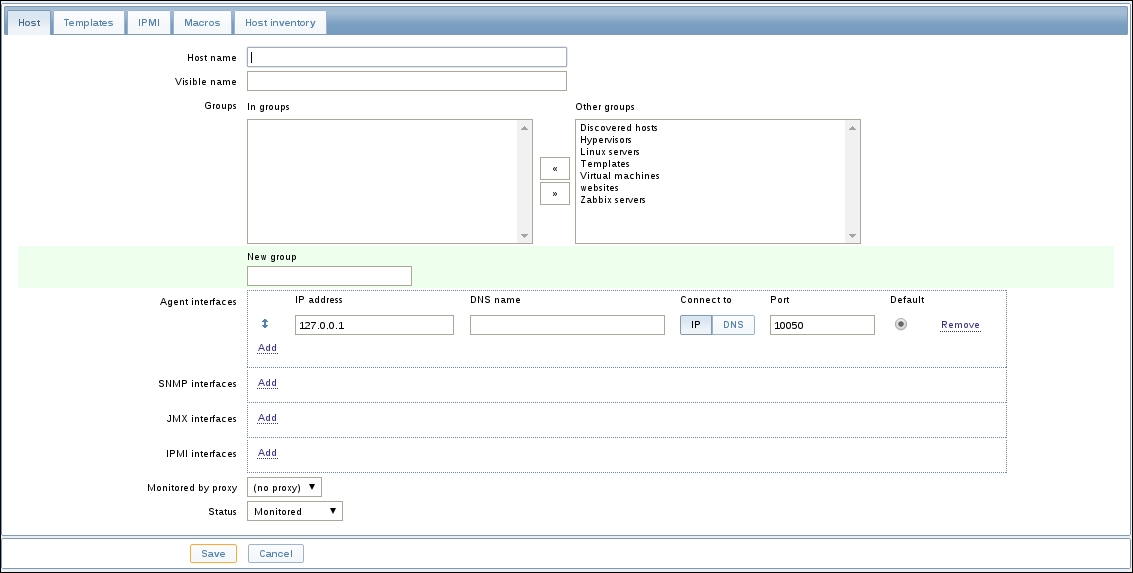
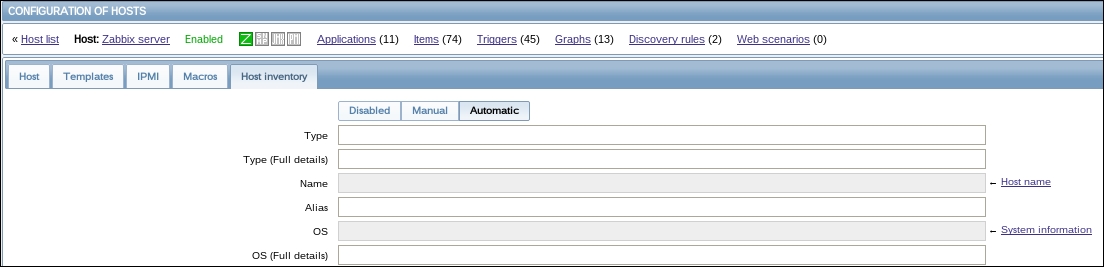
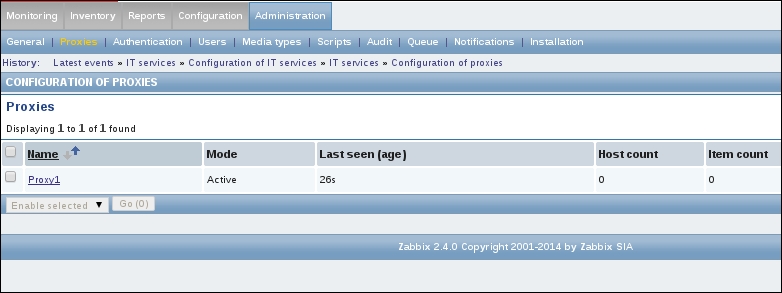
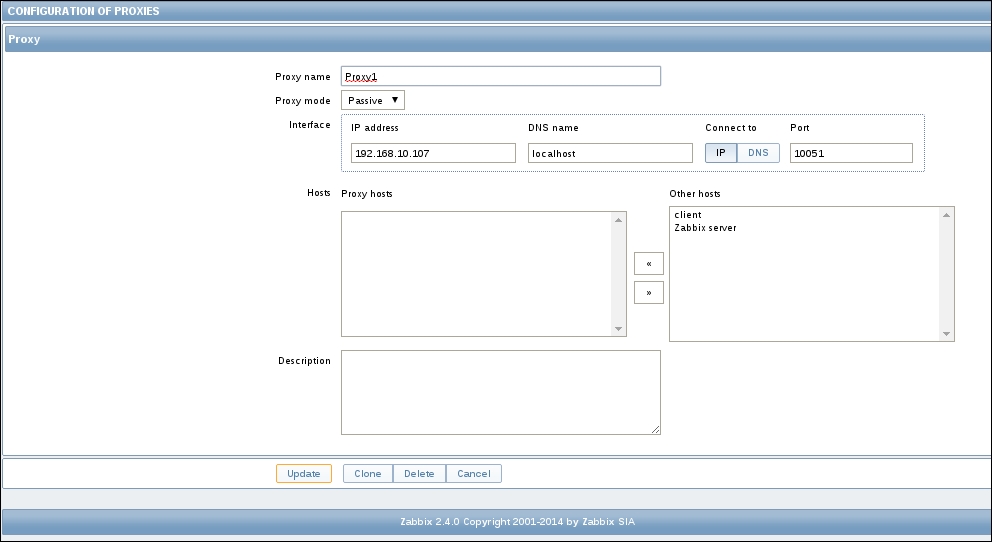
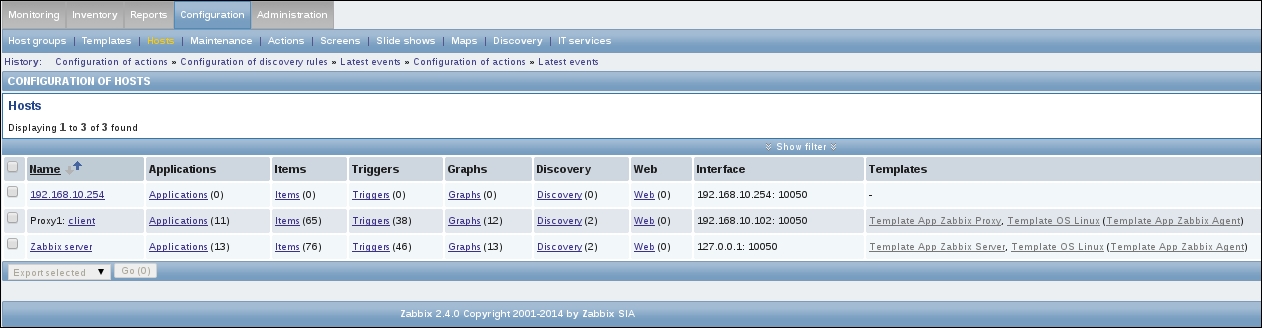
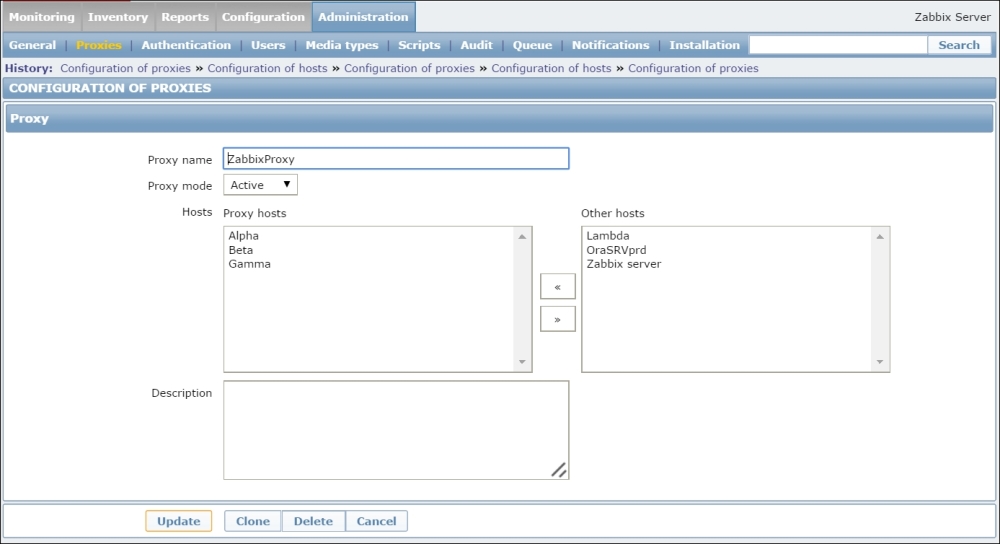
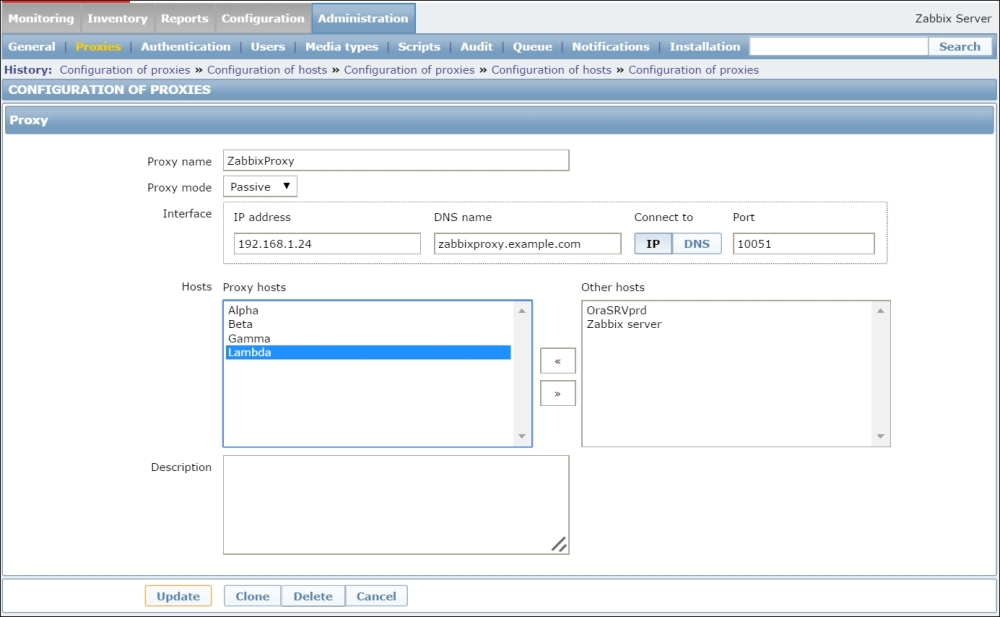
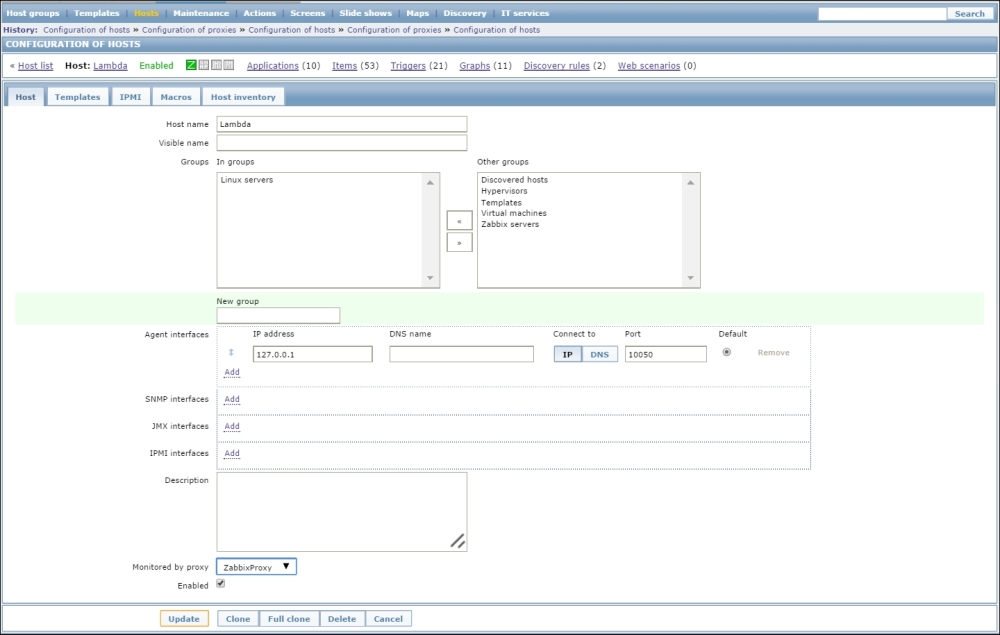
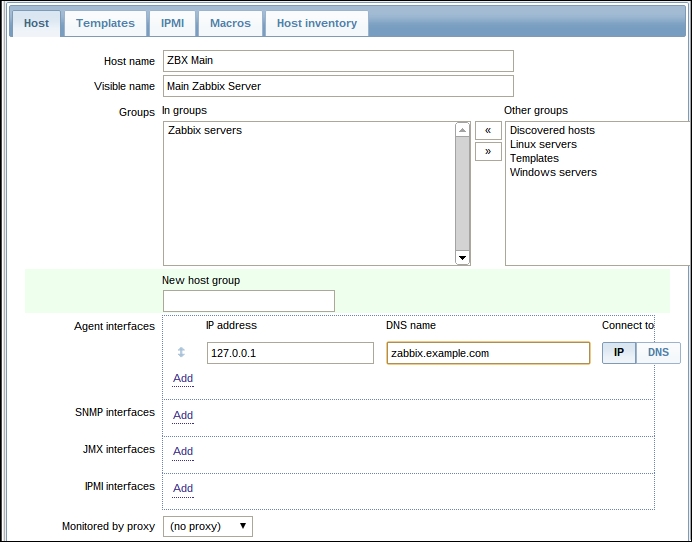
Once the agent has been started, we also have to add this new host to the configuration, so go to Configuration | Hosts. Make sure that the Group dropdown in the upper-right corner says Linux servers. Click on the Create host button and fill in this form:
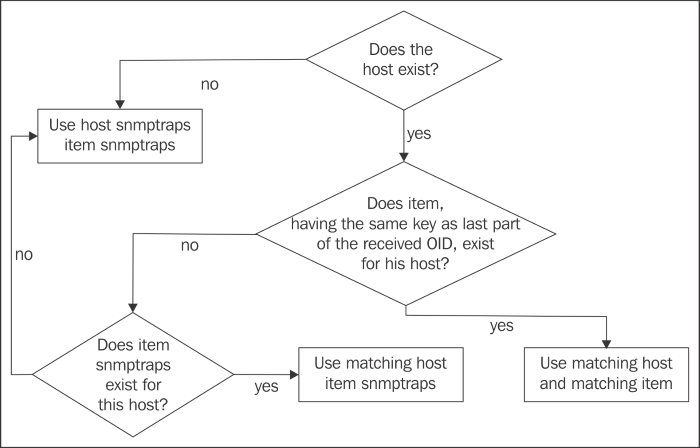
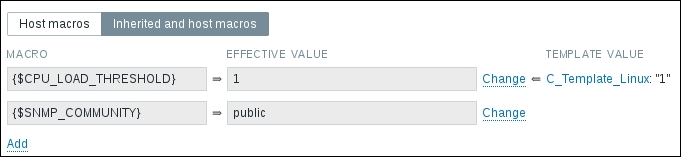
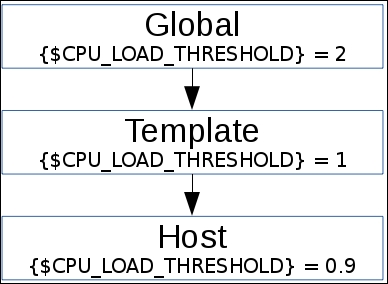
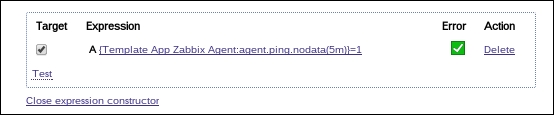
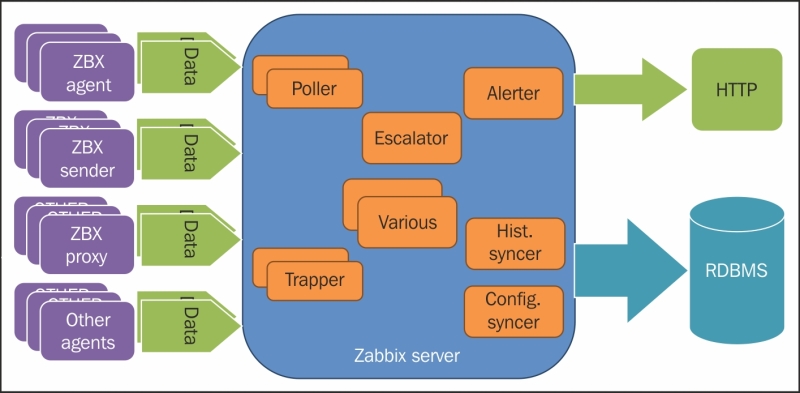
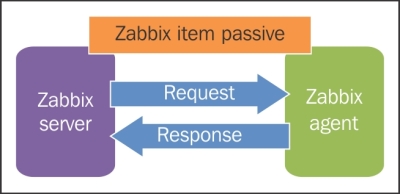
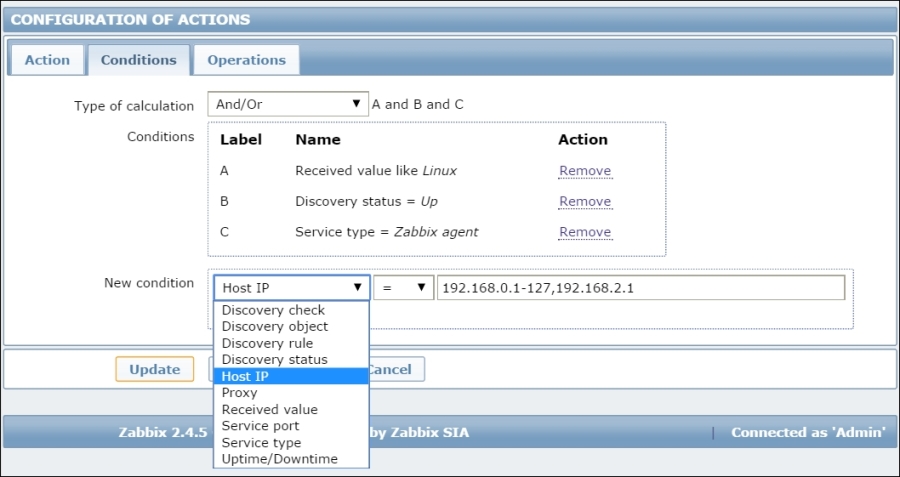
The item we created before was a so-called passive item, which means that the Zabbix server initiates a connection to the agent every time a value has to be collected. In most locations, they are simply referred to as being of the Zabbix agent type.
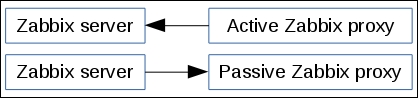
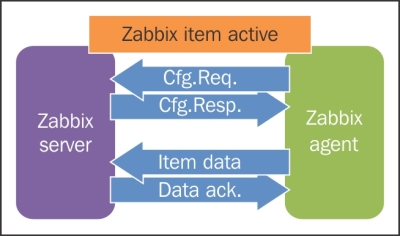
An easy way to remember what's passive or active in Zabbix is to think from the agent's perspective. If the agent connects to the server, it's active. If not, it's passive:
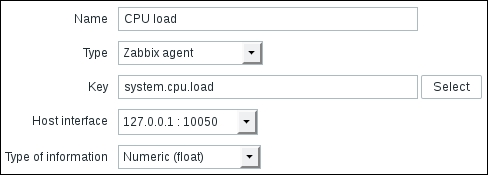
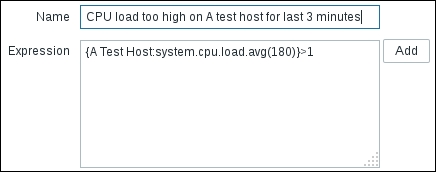
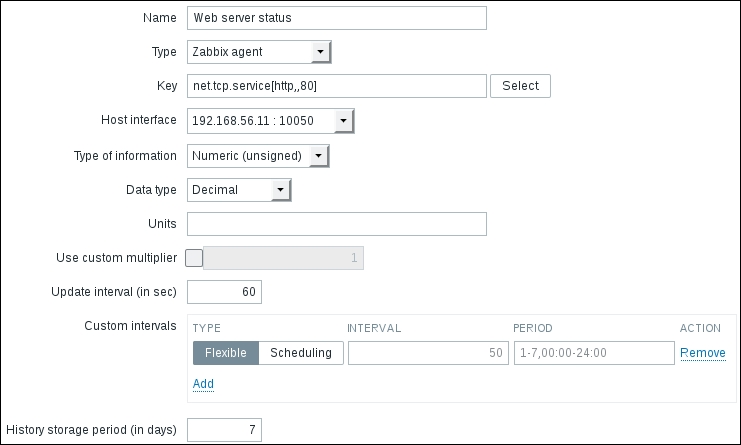
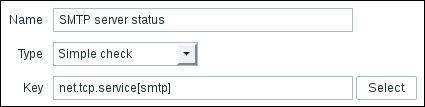
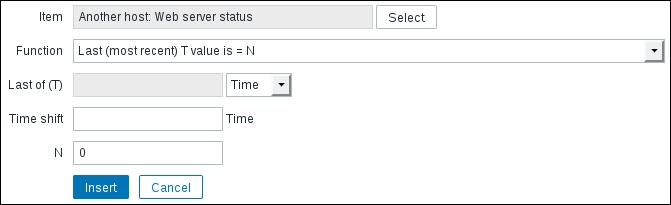
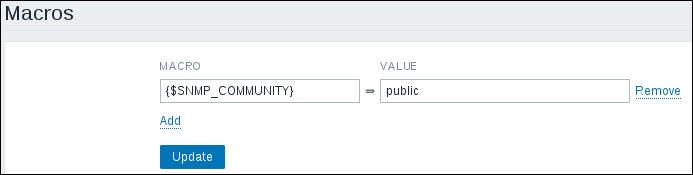
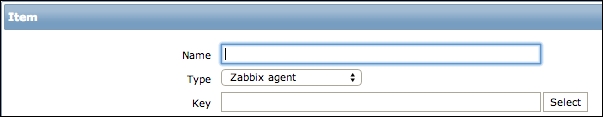
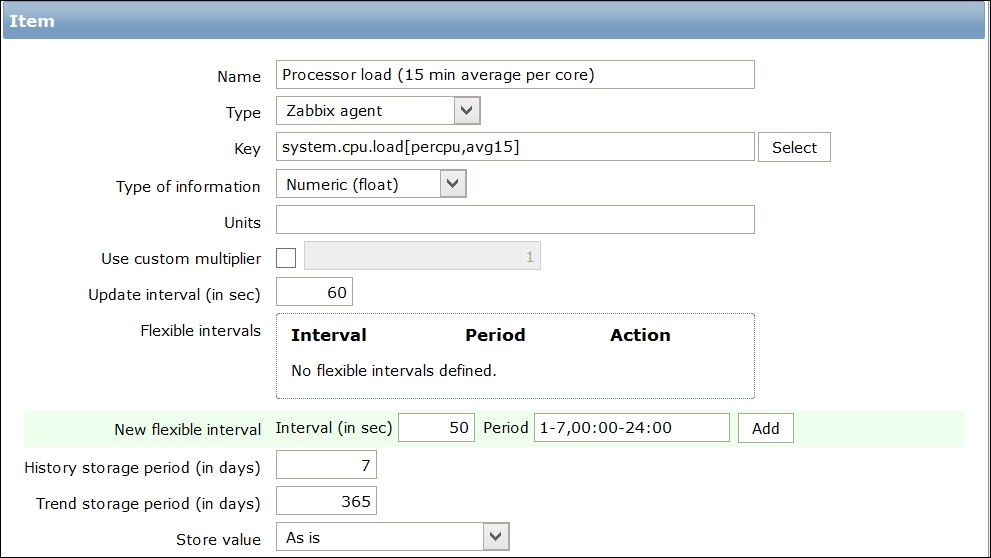
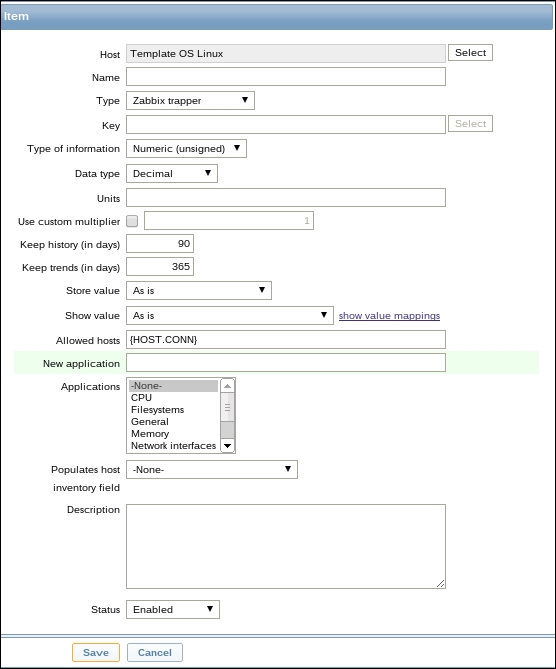
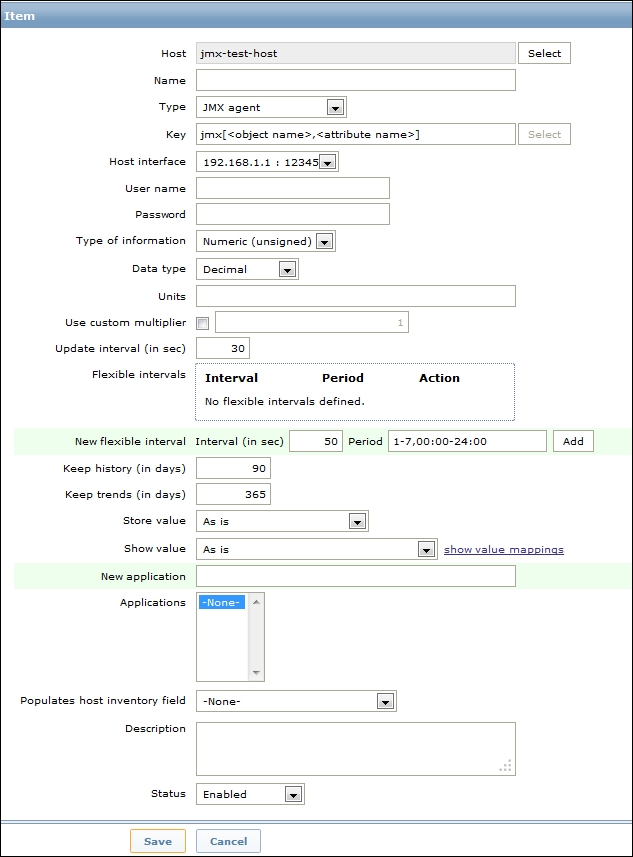
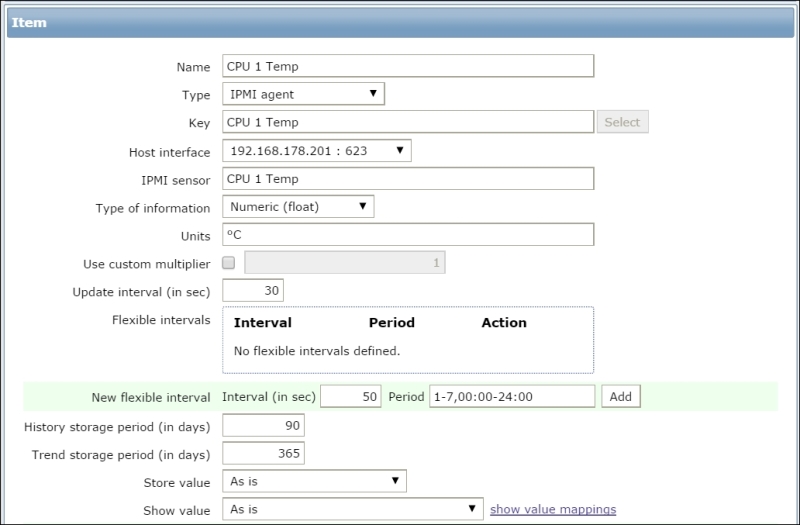
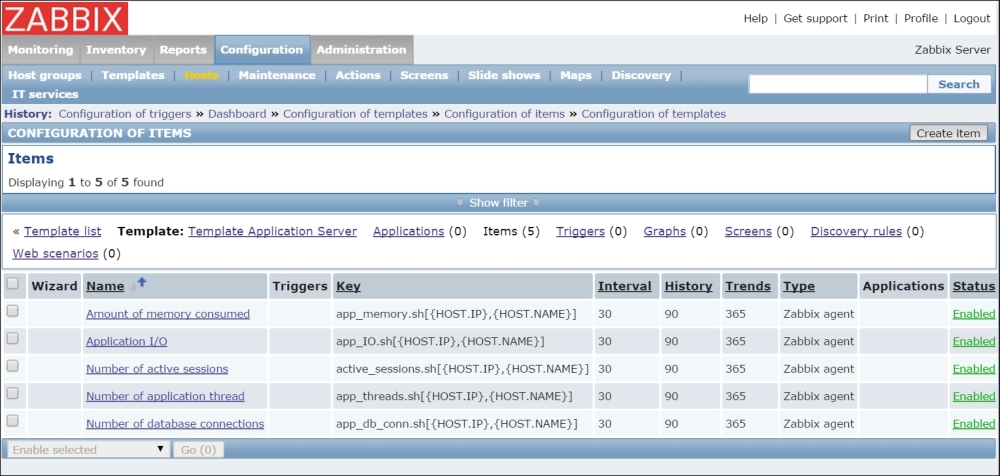
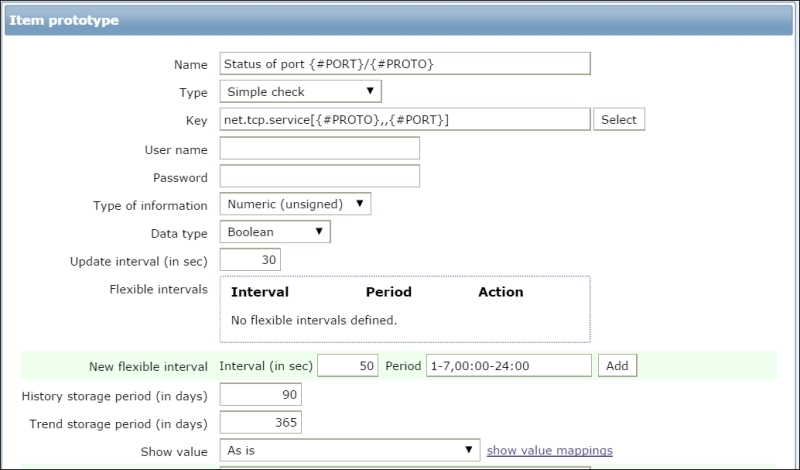
Let's create another passive item to check for the remote host. Go to Configuration | Hosts, click on Items next to the host you just created, click on the Create item button, and fill in these values:
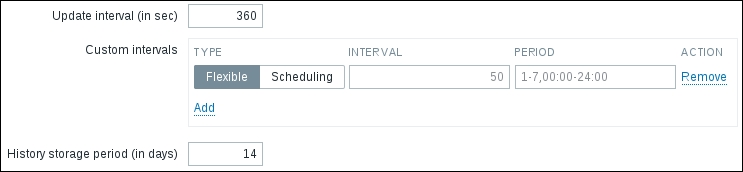
Name: Enter Web server status
Key: Enter net.tcp.service[http,,80] (that's two subsequent commas preceding 80)
Update interval (in sec): Change to 60 from the default (30)—once a minute should be more than enough for our needs
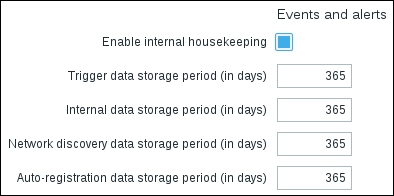
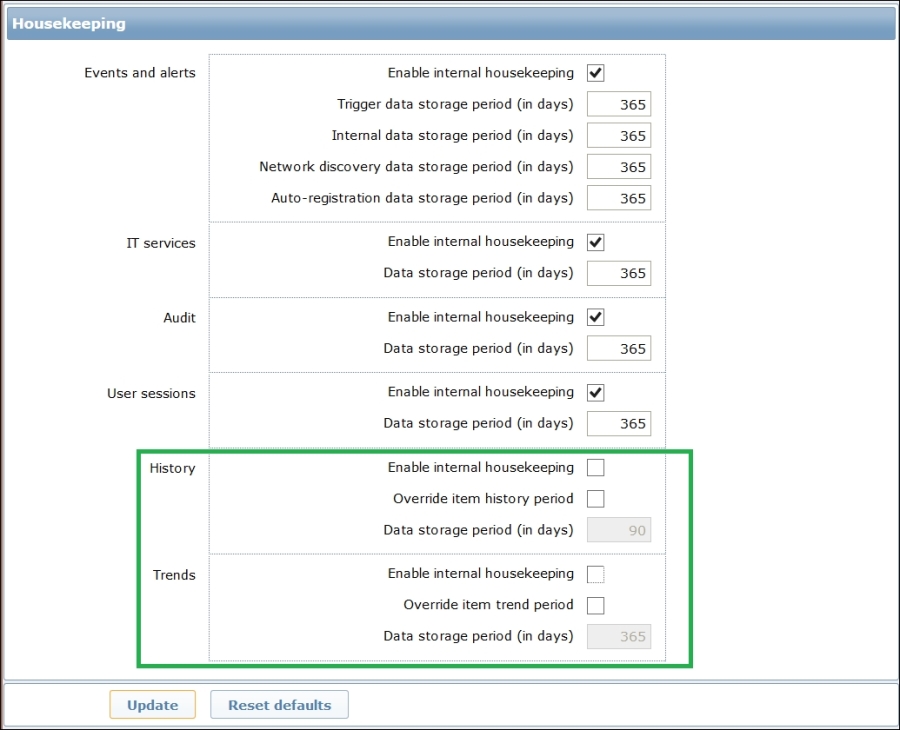
History storage
period (in days): Change to 7 from the default (90)—that's still a whole week of exact per-minute service status records kept
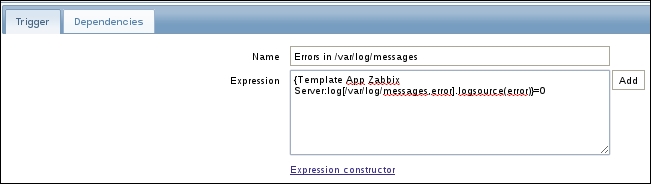
The end result should be as follows:
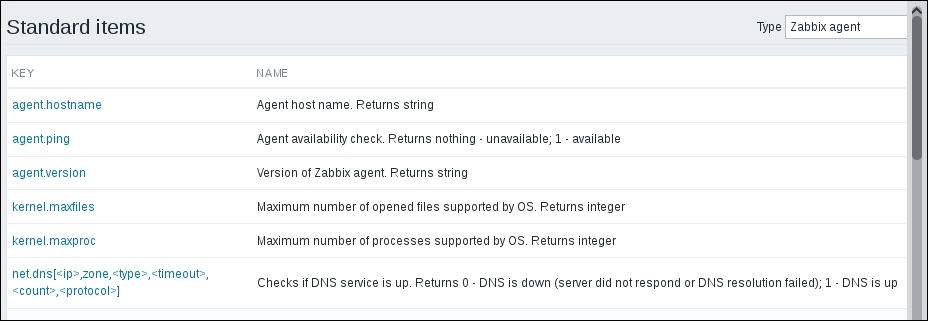
But what's up with that ,,80 added to the service name? Click on the Select button next to the Key field. This opens a window with a nice list of keys to choose from, along with a short description of each:
The Type dropdown in the upper-right corner will allow you to switch between several item types—we'll discuss the other types later. For now, find net.tcp.service in the list and look at the description. There are two things to learn here: firstly, we didn't actually have to add that 80—it's a port, and given that the default already is 80, adding it was redundant. However, it is useful if you have a service running on a nonstandard port. Secondly, there's a key list just one click away to give you a quick hint in case you have forgotten a particular key or what its parameters should be like.
This key, net.tcp.service, is a bit special: it tries to verify that the corresponding service actually does respond in a standard manner, which means the service must be explicitly supported. As of writing this, Zabbix supports the following services for the net.tcp.service key:
FTP
HTTP
HTTPS
IMAP
LDAP
NNTP
POP
SMTP
SSH
TCP
Telnet
The TCP service is a bit special in its own way. While others perform service-specific checks, TCP is not really a service; it just checks the TCP connection. It's closer to a key you can see a couple of rows above in the item list, net.tcp.port. As the description says, this one just tries to open a TCP connection to any arbitrary port without performing any service-specific checks on the returned value. If you try to use an arbitrary service string that is not supported, you would simply get an error message saying that such an item key is not supported.
Note
There's also a net.udp.service key that currently supports only one service—Network
Time Protocol (NTP).
Feel free to look at the other available keys—we will use a couple of them later as well—then close this popup and click on the Add button at the bottom.
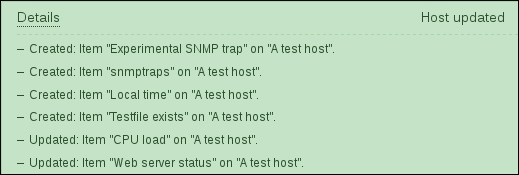
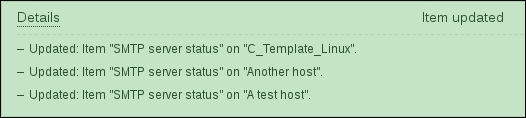
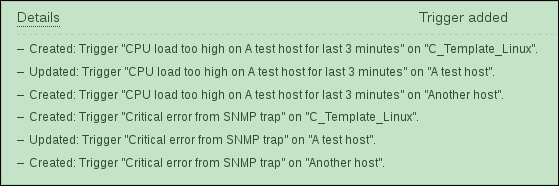
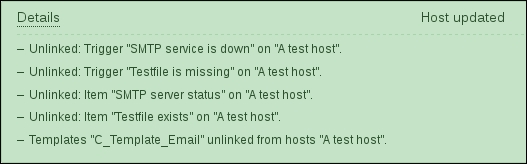
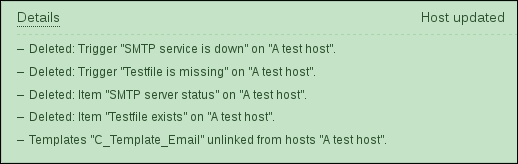
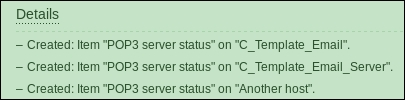
You have probably already noticed the green strip at the top of the screen when some operation successfully completes. This time, there's also a control called Details available; click on it to expand the details:
You can click on Details again to collapse the contents. Of course, this can be done whenever the Details link is available after some operation.
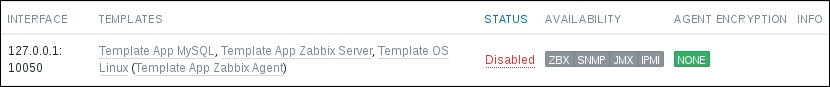
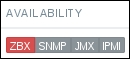
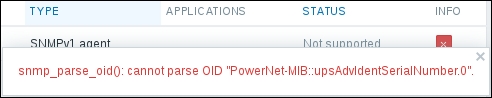
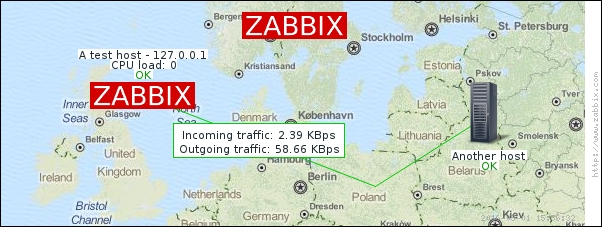
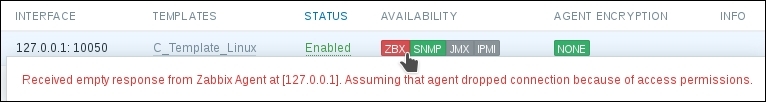
Now, we could go over to Monitoring | Latest data and wait for the values appearing there, but that would be useless. Instead, after a couple of minutes, you should visit Configuration | Hosts. Depending on your network configuration, you might see a red ZBX marker next to this host. This icon represents errors that have occurred when attempting to gather data from a passive Zabbix agent.
To see the actual error message, move your mouse cursor over the icon, and a tooltip will open. Clicking on the error icon will make the tooltip permanent and allow you to copy the error message.
Note
The three additional entries represent the SNMP, JMX, and IPMI data-gathering statuses. We will monitor SNMP devices in Chapter 4, Monitoring SNMP Devices, IPMI devices in Chapter 16, Monitoring IPMI Devices, and JMX applications in Chapter 17, Monitoring Java Applications.
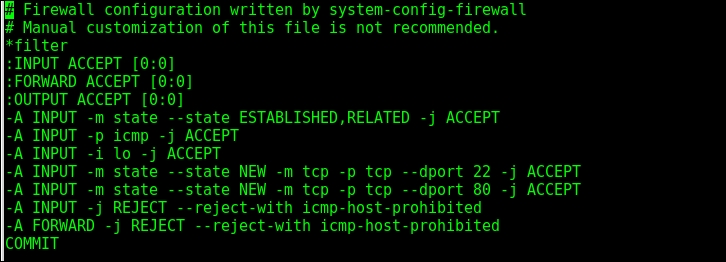
If you see an error message similar to Get value from agent failed: cannot connect to [[192.168.56.11]:10050]: [111] Connection refused (most likely with a different IP address), it means that the Zabbix server was unable to connect to the agent daemon port. This can happen because of a variety of reasons, the most common being a firewall—either a network one between the Zabbix server and the remote host or a local one on the remote host. Make sure to allow connections from the Zabbix server to the monitored machine on port 10050.
If you did this correctly (or if you did not have a firewall blocking the connection), you could again go to Monitoring | Latest data—only that would be pointless, again. To see why, refresh the host list. Soon, you should see the Zabbix agent status icon turn red again, and moving your mouse cursor over it will reveal another error message, Received empty response from Zabbix Agent at [192.168.56.11], assuming that the agent dropped the connection because of access permissions. Now that's different. What access permissions is it talking about, and why did they work for our first host?
From the Zabbix server, execute this:
Note
You should always verify network connectivity and access permissions from the Zabbix server. Doing it from another machine can have wildly differing and useless results.
Replace the IP address with the one of your remote host. You should see the following output, and the connection should immediately be closed:
Now, try the same with localhost:
Notice how this time the connection is not closed immediately, so there's a difference in the configuration. The connection will most likely be closed a bit later—3 seconds later, to be more specific. If this does not happen for some reason, press Ctrl+], as instructed, then enter quit—this should close the connection:
It turns out that configuring the Zabbix agent daemon on another machine is going to be a tiny bit harder than before.
As opposed to the installation on the Zabbix server, we have to edit the agent daemon configuration file on the remote machine. Open zabbix_agentd.conf as root in your favorite editor and take a look at the Server parameter. It is currently set to 127.0.0.1, which is the reason we didn't have to touch it on the Zabbix server. As the comment states, this parameter should contain the Zabbix server IP address, so replace 127.0.0.1 with the correct server address here.
Note
If you have older Zabbix agent instances in your environment, make sure to use and edit zabbix_agentd.conf, with d in the name. The other file, zabbix_agent.conf, was used by the limited-functionality zabbix_agent module, which has been removed in Zabbix 3.0.
Save the file and restart the agent daemon. How exactly this is done depends on the installation method, again. If you installed from the distribution packages, the following will most likely work:
If you installed from the source and did not create or adapt some init scripts, you will have to manually stop and start the agent process:
The preceding command will stop all processes called zabbix_agentd on the system. This should not be used if multiple agents are running on the system. Additionally, the delay of 3 seconds should be more than enough in most cases, but if the agent does not start up after this, check its logfile for potential reasons.
Note
Never use kill -9 with Zabbix daemons. Just don't. Even if you think you could, do not do it. Signal 15 is SIGTERM—it tells the daemon to terminate, which means writing any outstanding data to the database, writing out and closing the logfiles, and potentially doing other things to shut down properly. Signal 9 is SIGKILL—the process is brutally killed without allowing it to say goodbye to the loved database and files. Unless you really know what you are doing, you do not want to do that—seriously, don't.
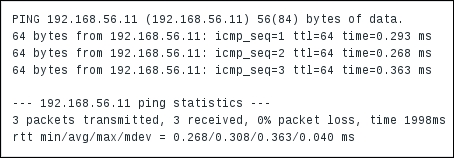
To verify the change, try telnetting to the remote machine again:
This time, the outcome should be the same as we had with the localhost: the connection should be opened and then closed approximately 3 seconds later.
Note
While some host interface must be specified for all hosts, even for those only using active items, it is only used for passive Zabbix agent checks. If such items are not configured, this interface is simply ignored.
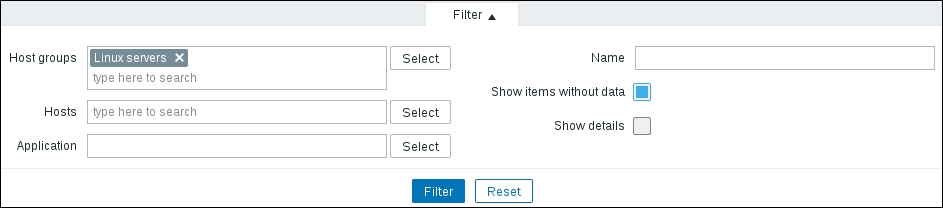
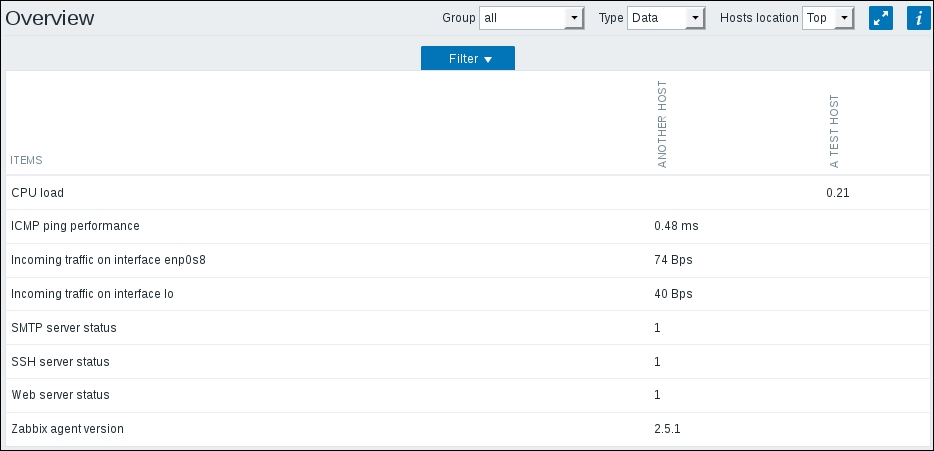
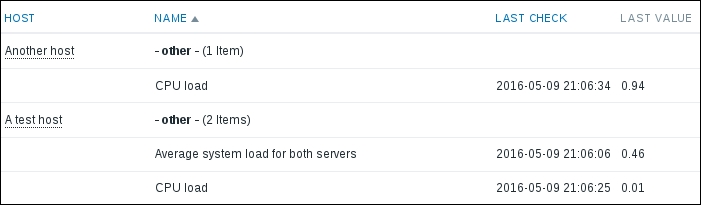
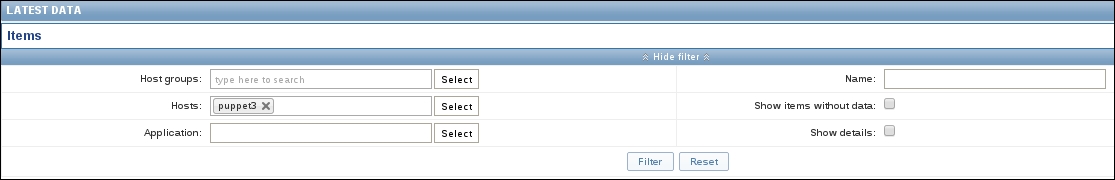
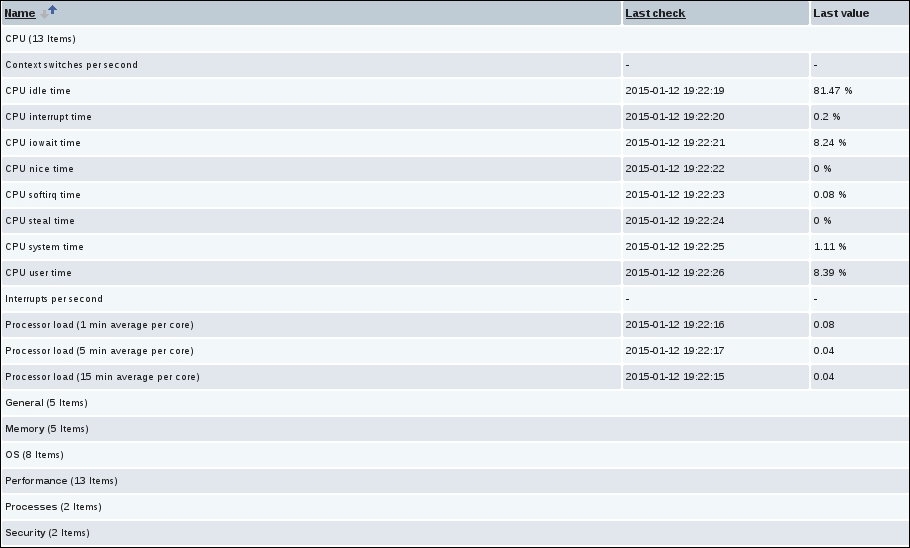
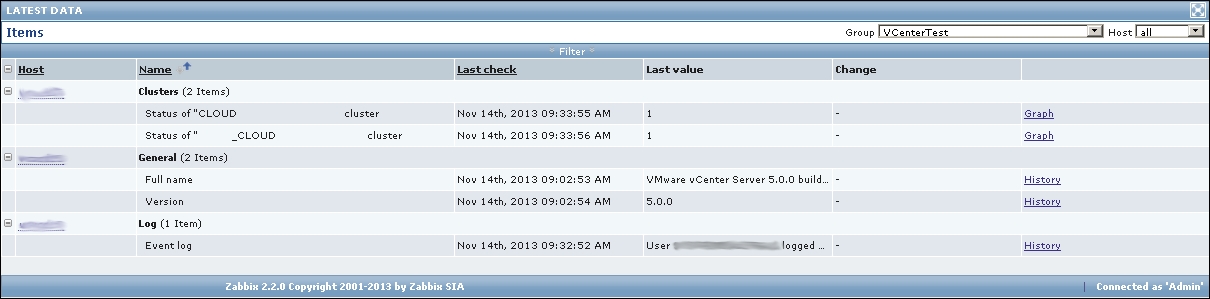
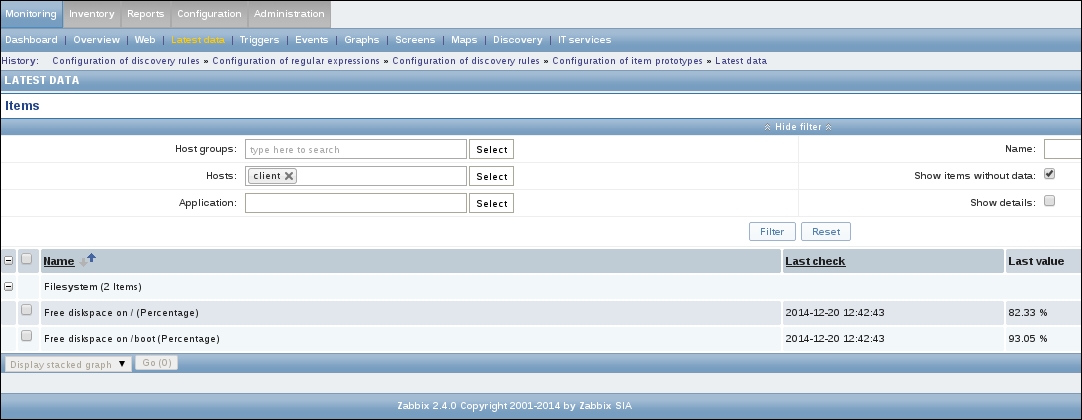
Finally, it should be worth opening Monitoring | Latest data. We will only see our previously created item, though; the reason is the same filter we changed earlier. We explicitly filtered for one host; thus, the second host we created does not show up at all. In the filter, which should still be expanded, clear the host field and select Linux servers in the Host groups field, and then click on Filter:
Note
In many filter fields in Zabbix, we can either start typing and get a list of matching entries or click on the Select button to see a list of all available entities. Typing in is a very convenient way when we know at least part of the name. Being able to see the list is helpful when working in an environment we are less familiar with.
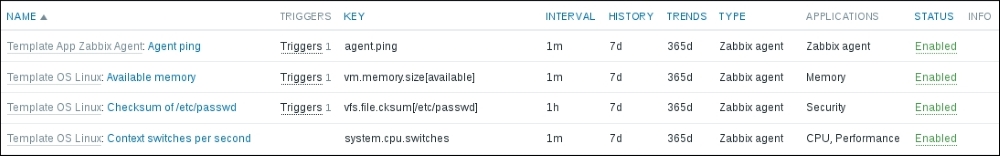
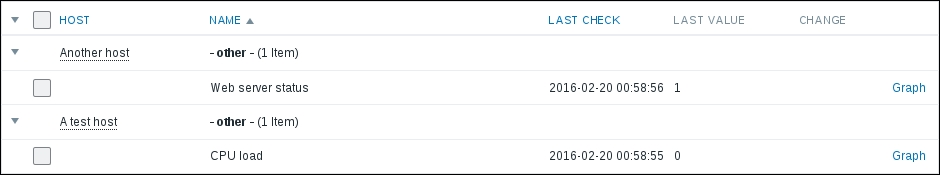
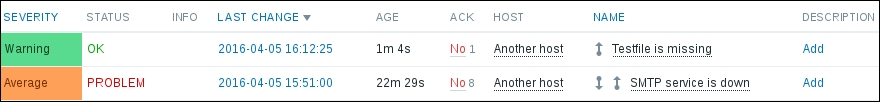
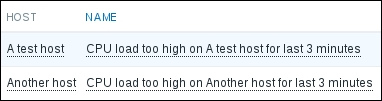
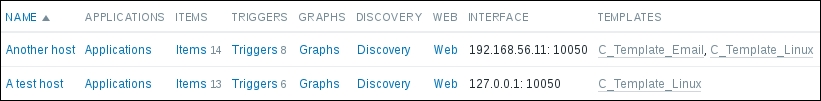
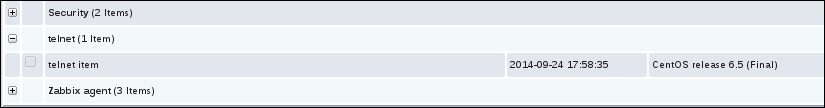
We should see two monitored hosts now, each having a single item:
Notice how we can click the triangle icon next to each entry or in the header to collapse and expand either an individual entry or all of the entries.
Let's try to monitor another service now, for example, the one running on port 22, SSH. To keep things simple for us, we won't create an item from scratch this time; instead, go back to Configuration | Hosts, click on Items next to Another host, and click on Web server status in the NAME column. This will open the item editing screen, showing all the values we entered before. This time, there are different buttons available at the bottom. Among other changes, instead of the Add button, there's an Update one.
Note
Notice how one of the previously seen buttons is different. What was labeled Add previously is Update now. This change identifies the operation that we are going to perform: either adding a new entity or updating an existing one. One might open a configuration form intending to clone the entity, scan the fields, change some values, but forget to click on the Clone button. In the end, the existing item will be changed. The difference in the labels of the Add and Update buttons might help spot such mistakes before they are made.
There's also Delete, which, obviously, deletes the currently open item. We don't want to do that now. Instead, click on Clone:
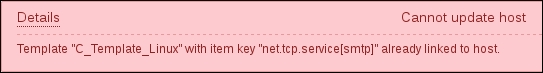
Notice how the opened form proposes to create a new item, but this time, all values are set to those that the original item we cloned had. The Update button is changed to Add as well. Click on the Add button—it should fail. Remember, we talked about the key being unique per host; that's what the error message says as well:
The item editing form is still open, so we can correct our mistake. Make the following modifications:
Name: Change it to SSH server status
Key: Change http,,80 to ssh so that it looks like this—net.tcp.service[ssh]
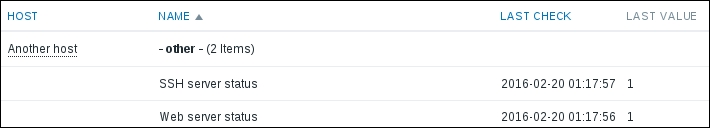
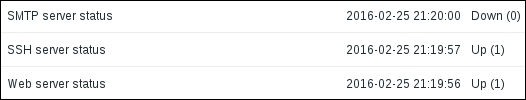
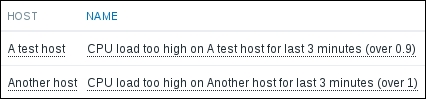
That's all we have to do for now, so click on the Add button at the bottom again. This time, the item should be added successfully. Now, navigate to Monitoring | Latest data, where Another host should have two items listed: SSH server status and Web server status. Their status will depend on which services are running on the remote host. As it's remote, SSH most likely is running (and thus has a value of 1), but whether or not the web server is running will be specific to your situation.
Note
The monitoring of a port is often done to make sure the service on it is available, but that is not a strict requirement. If some system is not supposed to have SSH available through the Internet, we could use such a check to verify that it has not been accidentally exposed either by the inadvertent starting of the SSH daemon or an unfortunate change in the firewall.
Adding items to the frontend and waiting for them to update is one way of seeing whether you got the item key right. It is not a very quick method, though—you have to wait for the server to get to checking the item. If you are not sure about the parameters or would like to test different combinations, the easiest way to do this is with a utility called zabbix_get. When installing from source, it is installed together with the Zabbix agent. When installing from the packages, it could be installed together with the Zabbix agent, or it could also be in a separate package. Using it is very simple: if we want to query the agent on the Zabbix server, we will run this:
This will obtain the value in the exact same way as the server would do it. If you would like to get values like this from Another host, you could run zabbix_get on the Zabbix server. Attempting to run it from the same host on which the agent runs will fail as we changed the Server parameter to accept connections from the Zabbix server only. If you would like to query the agent from the localhost for debugging purposes, 127.0.0.1 can be added to the Server parameter via a comma—this is sometimes done on all systems when deploying the agent.
This covers the basics of normal, or passive, Zabbix items, where the server queries agents. Let's move on to other item types.
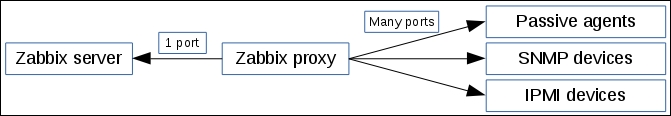
Passive Zabbix items are fine if you can connect to all the monitored hosts from the Zabbix server, but what if you can't allow incoming connections to the monitored hosts because of security or network topology reasons?
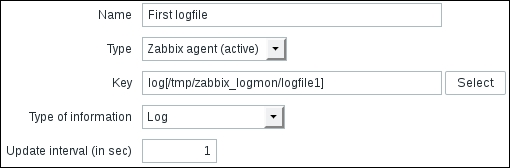
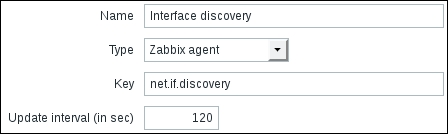
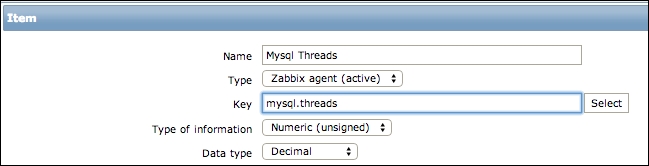
This is where active items come into play. As opposed to passive items, for active items, it's the agent that connects to the server; the server never connects to the agent. When connecting, the agent downloads a list of items to check and then reports the new data to the server periodically. Let's create an active item, but this time, we'll try to use some help when selecting the item key.
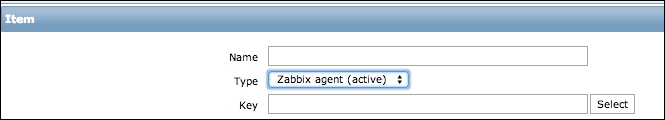
Go to Configuration | Hosts, click on Items next to Another host, and click on Create item. For now, use these values:
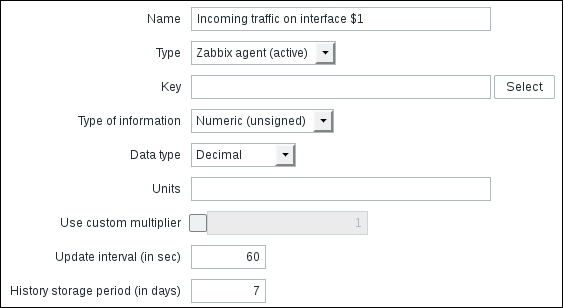
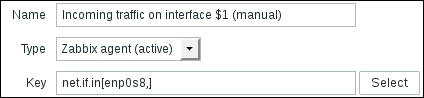
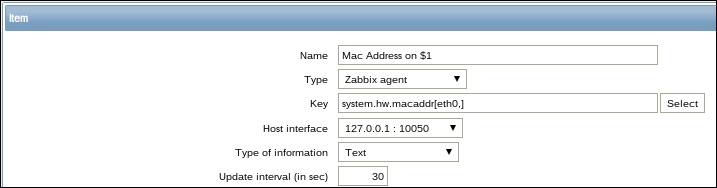
Name: Incoming traffic on interface $1
Type: Zabbix agent (active)
Update interval (in sec): 60
History storage period (in days): 7
We'll do something different with the Key field this time. Click on the Select button, and in the upcoming dialog that we saw before, click on net.if.in[if,<mode>]. This will fill in the chosen string, as follows:
Note
Replace the content in the square brackets with eth0 so that the field contents read net.if.in[eth0]. When you're done, click on the Add button at the bottom. Never leave placeholders such as <mode>—they will be interpreted as literal values and the item will not work as intended.
If your system has a different network interface name, use that here instead of eth0. You can find out the interface names with the ifconfig or ip addr show commands. In many modern distributions, the standard ethX naming scheme has been changed to one that will result in various different interface names. Further, replace any occurrences of eth0 with the correct interface name.
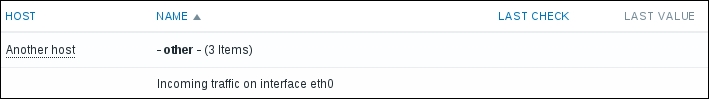
Go to Monitoring | Latest data and check whether new values have arrived:
Well, it doesn't look like they have. You could wait a bit to be completely sure, but most likely, no data will appear for this new active item, which means we're in for another troubleshooting session.
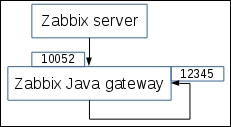
First, we should test basic network connectivity. Remember: active agents connect to the server, so we have to know which port they use (by default, it's port 10051). So, let's start by testing whether the remotely monitored machine can connect to the Zabbix server:
This should produce output similar to the following:
Press Ctrl + ] and enter quit in the resulting prompt:
Such a sequence indicates that the network connection is working properly. If it isn't, verify possible network configuration issues, including network firewalls and the local firewall on the Zabbix server. Make sure to allow incoming connections on port 10051.
Note
Both agent and server ports for Zabbix are registered with the Internet Assigned
Numbers Authority (IANA).
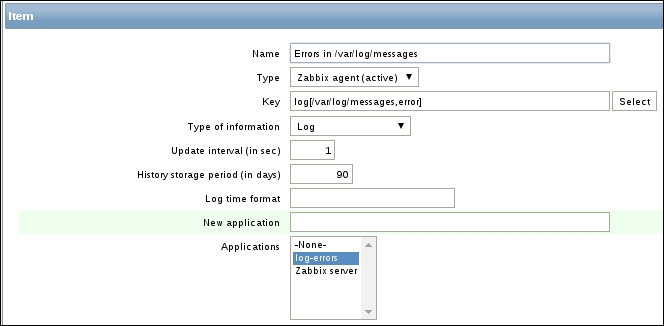
So, there might be something wrong with the agent—let's take a closer look. We could try to look at the agent daemon's logfile, so find the LogFile configuration parameter. If you're using the default configuration files from the source archive, it should be set to log to /tmp/zabbix_agentd.log. If you installed from packages, it is likely to be in /var/log/zabbix or similar. Open this logfile and look for any interesting messages regarding active checks. Each line will be prefixed with a PID and timestamp in the syntax PID:YYYYMMDD:HHMMSS. You'll probably see lines similar to these:
The agent is trying to request the active check list, but the connection fails. The attempt seems to be wrong—our Zabbix server should be on a different system than the localhost. Let's see how we can fix this. On the remote machine, open the zabbix_agentd.conf configuration file and check the ServerActive parameter. The default configuration file will have a line like this:
This parameter tells the agent where it should connect to for active items. In our case, the localhost will not work as the Zabbix server is on a remote machine, so we should modify this. Replace 127.0.0.1 with the IP address or DNS name of the Zabbix server, and then restart the agent either using an init script or the manual method killall.
While you have the configuration file open, take a look at another parameter there—StartAgents. This parameter controls how many processes are handling incoming connections for passive items. If set to 0, it will prevent the agent from listening on incoming connections from the server. This enables you to customize agents to support either or both of the methods. Disabling passive items can be better from a security perspective, but they are very handy for testing and debugging various problems. Active items can be disabled by not specifying (commenting out) ServerActive. Disabling both active and passive items won't work; the agent daemon will complain and refuse to start up, and it's correct—starting with both disabled would be a pointless thing to do. Take a look:
We could wait for values to appear on the frontend again, but again, they would not. Let's return to the agent daemon logfile and see whether there is any hint about what's wrong:
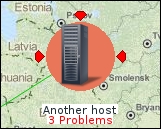
If we carefully read the entry, we will notice that the agent is reporting its hostname as Zabbix server, but that is the hostname of the default host, which we decided not to use and left disabled. The log message agrees: it says that the host is not monitored.
If we look at the startup messages, there's even another line mentioning this:
Note
You might or might not see the SVN revision in this message depending on how the agent was compiled. If it's missing, don't worry about it as it does not affect the ability of the agent to operate.
As that is not the host name we want to use, let's check the agent daemon configuration file again. There's a parameter named Hostname, which currently reads Zabbix server. Given that the comment for this parameter says "Required for active checks and must match hostname as configured on the server.", it has to be what we're after. Change it to Another host, save and close the configuration file, and then restart the Zabbix agent daemon. Check for new entries in the zabbix_agentd.log file—there should be no more errors.
While we're at it, let's update the agent configuration on A test host as well. Modify zabbix_agentd.conf and set Hostname=A test host and restart the agent daemon.
If there still are errors about the host not being found on the server, double-check that the hostname in the Zabbix frontend host properties and agent daemon configuration file (the one we just changed) match.
Note
This hostname is case sensitive.
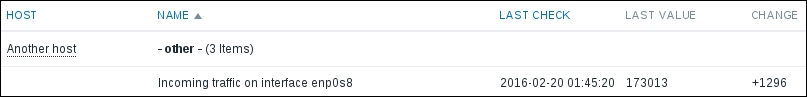
It's now time to return to the frontend and see whether data has started flowing in at the Monitoring | Latest data section:
Note
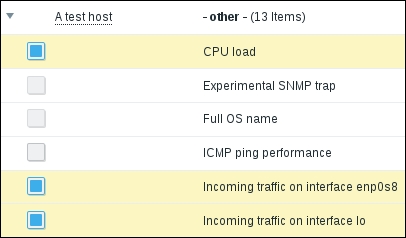
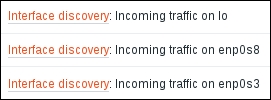
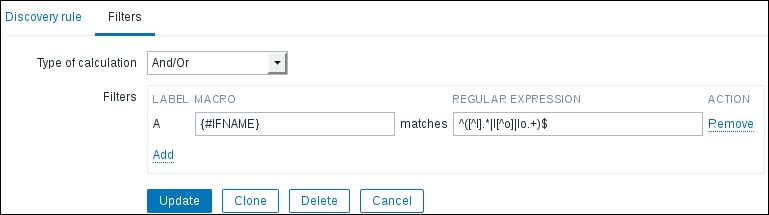
Notice how the system in this screenshot actually has an interface named enp0s8, not eth0. We will find out how to allow Zabbix to worry about interface names and discover them automatically in Chapter 12, Automating Configuration.
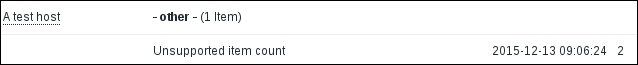
If you see no data and the item shows up unsupported in the configuration section, check the network interface name.
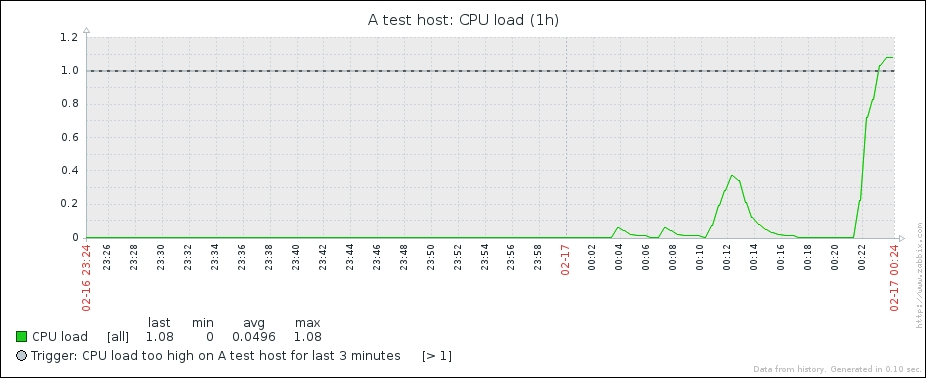
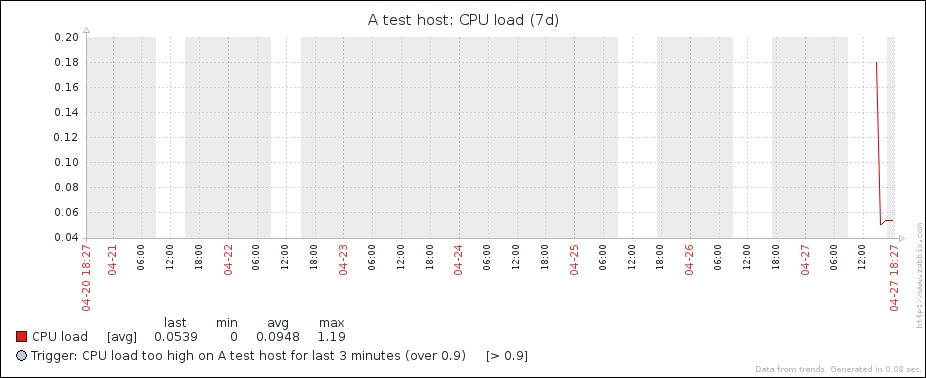
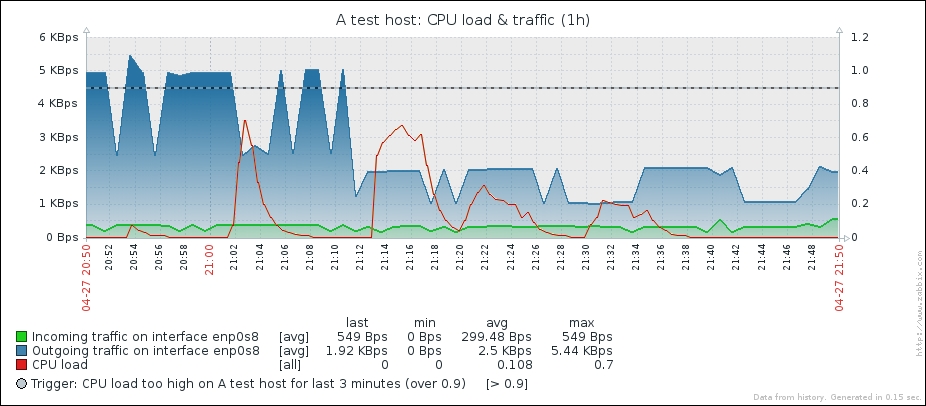
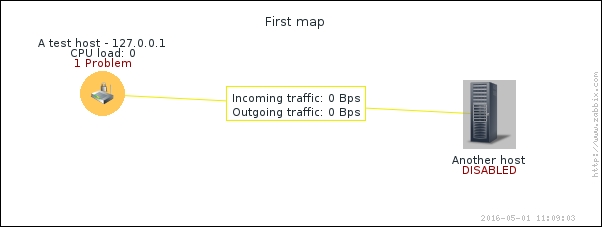
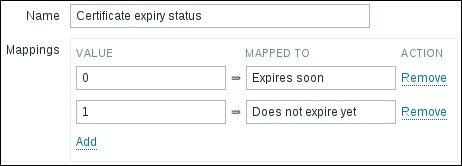
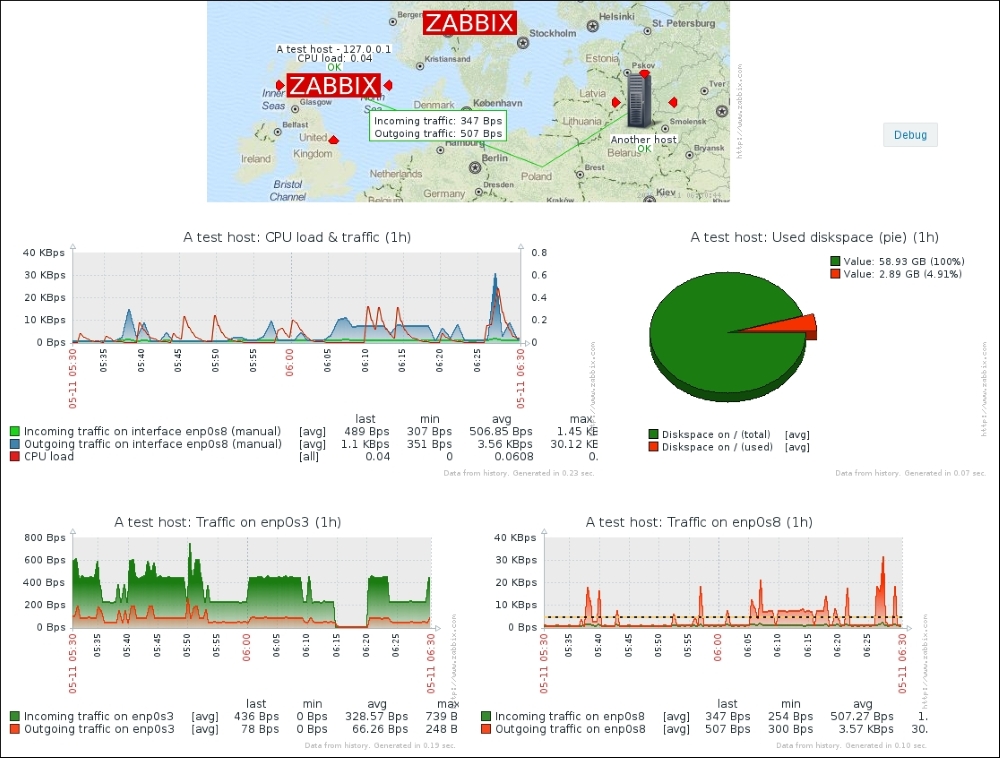
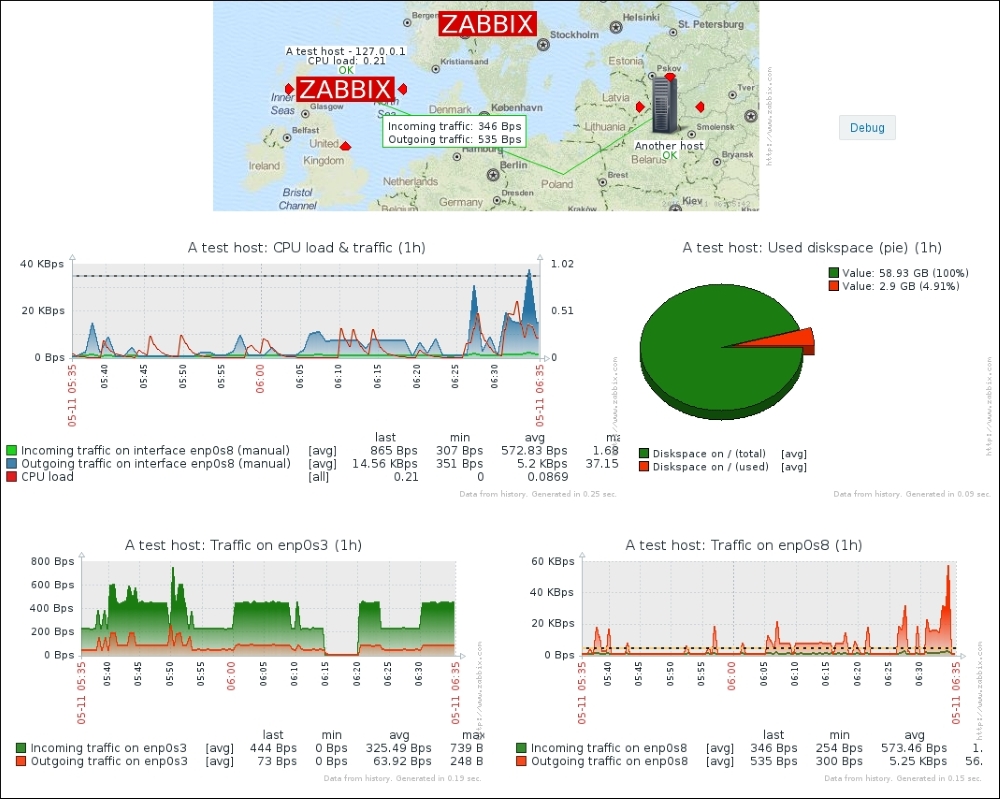
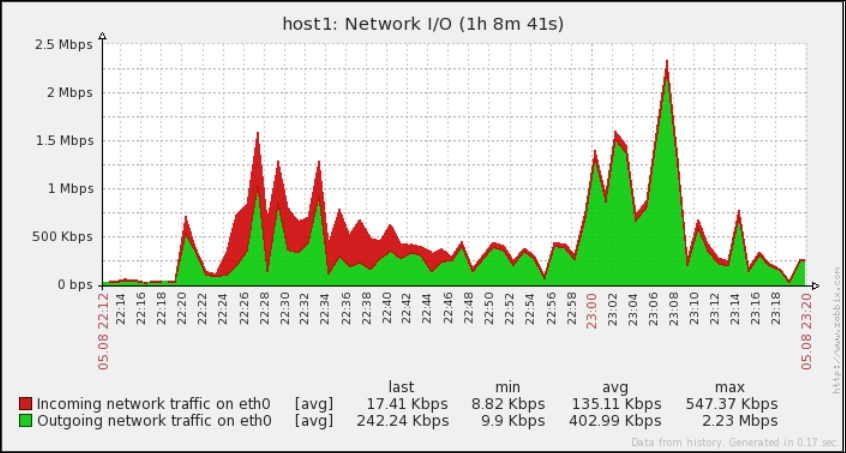
Great, data is indeed flowing, but the values look really weird. If you wait for a while, you'll see how the number in the LAST VALUE column just keeps on increasing. So what is it? Well, network traffic keys gather data from interface counters, that is, the network interface adds up all traffic, and this total data is fed into the Zabbix database. This has one great advantage: even when data is polled at large intervals, traffic spikes will not go unnoticed as the counter data is present, but it also makes data pretty much unreadable for us, and graphs would also look like an ever-growing line (if you feel like it, click on the Graph link for this item). We could even call them "hill graphs". Luckily, Zabbix provides a built-in capability to deal with data counters like this. Go to Configuration | Hosts, then click on Items next to Another host, and click on Incoming traffic on interface eth0 in the NAME column. Change the Store value dropdown to read Delta (speed per second), and then click on Update.
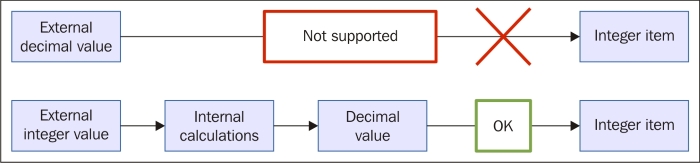
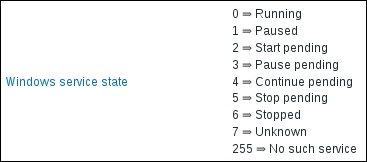
We will have to wait a bit for the changes to take effect, so now is a good moment to discuss our choice for the Type of information option for this item. We set it to Numeric (unsigned), which accepts integers. The values that this item originally receives are indeed integers—they are counter values denoting how many bytes have been received on this interface. The Store value option we changed to Delta (speed per second), though, will almost always result in some decimal part being there—it is dividing the traffic between two values according to the number of seconds passed between them. In cases where Zabbix has a decimal number and has to store it in an integer field, the behavior will differ depending on how it got that decimal value, as follows:
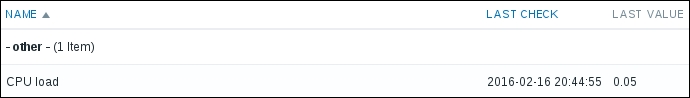
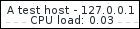
If the decimal value arrived from a Zabbix agent source like a system.cpu.load item, the item will turn up unsupported
If Zabbix received an integer but further calculations resulted in a decimal number appearing, like with our network item, the decimal part will be discarded
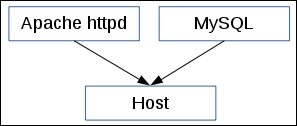
This behavior is depicted in the following figure:
Why is there a difference like this, and why did we leave this item as an integer if doing so results in a loss of precision? Decimal values in the Zabbix database schema have a smaller number of significant digits available before the decimal point than integer values. On a loaded high-speed interface, we might overflow that limit, and it would result in values being lost completely. It is usually better to lose a tiny bit of precision—the decimal part—than the whole value. Note that precision is lost on the smallest unit: a byte or bit. Even if Zabbix shows 5 Gbps in the frontend, the decimal part will be truncated from this value in bits; thus, this loss of precision should be really, really insignificant. It is suggested to use integers for items that have a risk like this, at least until database schema limits are increased.
Check out Monitoring | Latest data again:
Note
Keep in mind that in the worst case, configuration changes might take up to 3 minutes to propagate to the Zabbix agent: 1 minute to get into the server configuration cache and 2 minutes until the agent refreshes its own item list. On top of this delay, this item is different from the others we created: it needs to gather two values to compute per second, one of which we are interested in; thus, we will also have to wait for whatever the item interval is before the first value appears in the frontend.
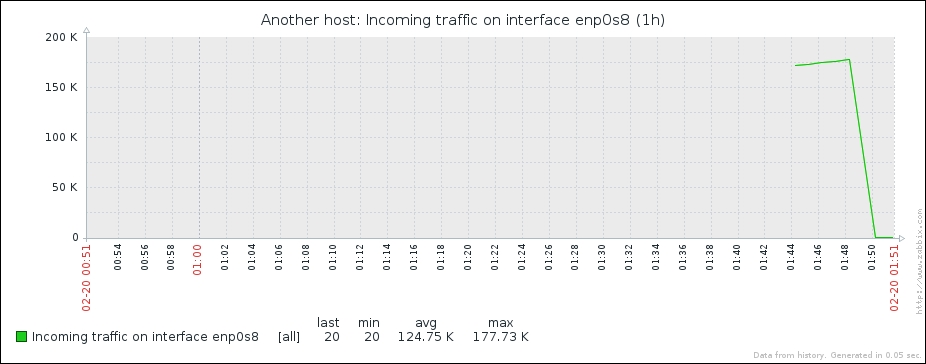
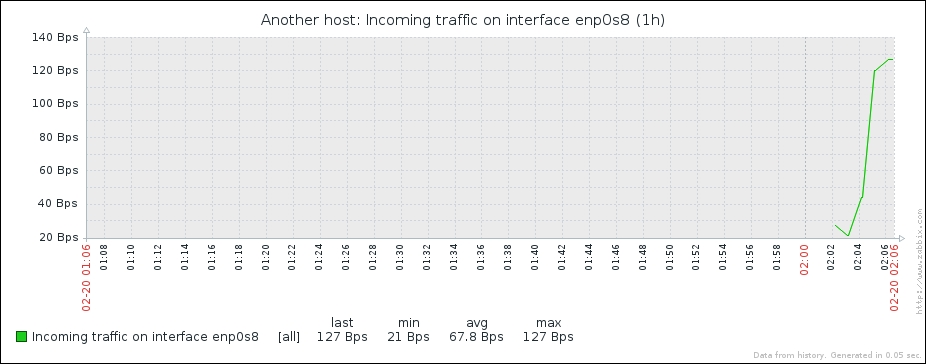
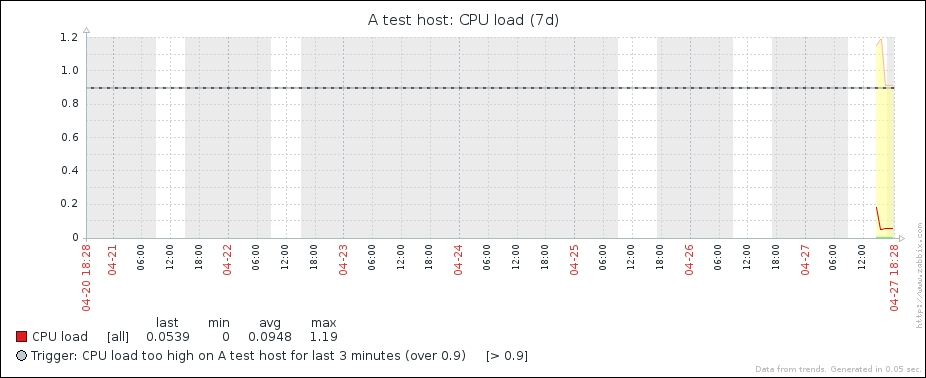
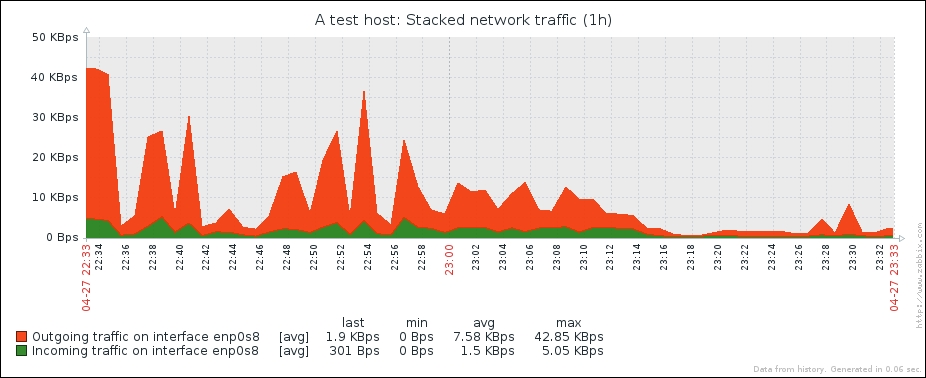
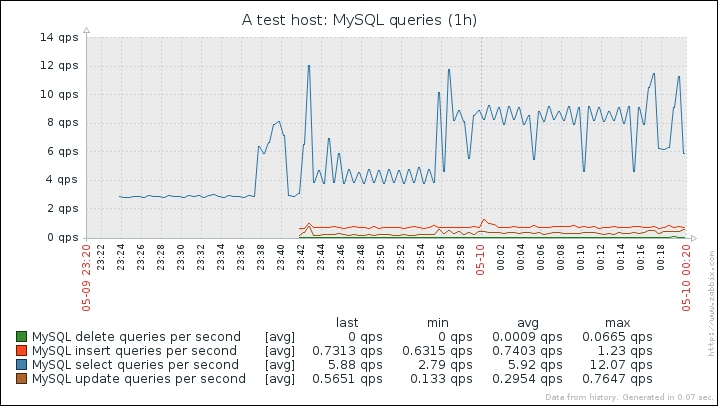
That's better; Zabbix now automatically calculates the change between every two checks (that's what the delta is for) and stores it, but the values still don't seem to be too user friendly. Maybe they're better in the graph—let's click on the Graph link to find out:
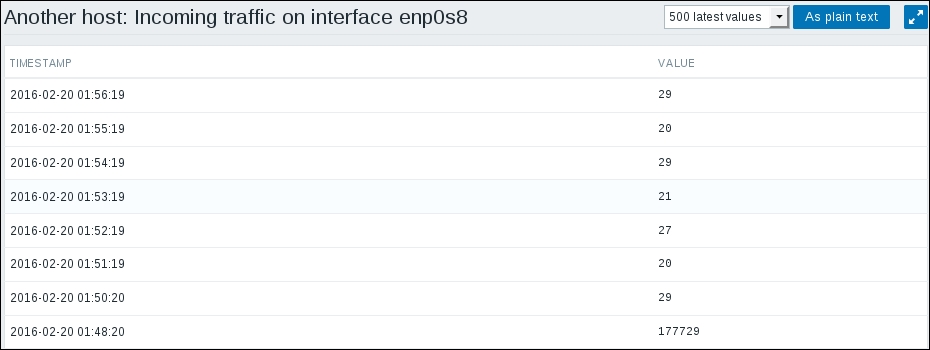
Ouch. While we can clearly see the effect our change had, it has also left us with very ugly historical data. The Y axis of that graph represents the total counter value (thus showing the total since the monitored system was started up), but the X axis represents the correct (delta) data. You can also take a look at the values numerically—go to the dropdown in the upper-right portion, which currently reads Graph. Choose 500 latest values from there. You'll get the following screen:
In this list, we can nicely see the change in data representation as well as the exact time when the change was performed. But those huge values have come from the counter data, and they pollute our nice, clean graph by being so much out of scale—we have to get rid of them. Go to Configuration | Hosts and click on Items next to Another host, then mark the checkbox next to the Incoming traffic on interface eth0 item, and look at the buttons positioned at the bottom of the item list:
The third button from the left, named Clear history, probably does what we want. Notice the 3 selected text to the left of the activity buttons—it shows the amount of entries selected, so we always know how many elements we are operating on. Click on the Clear history button. You should get a JavaScript popup asking for confirmation to continue. While history cleaning can take a long time with large datasets, in our case, it should be nearly instant, so click on the OK button to continue. This should get rid of all history values for this item, including the huge ones.
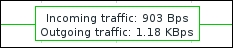
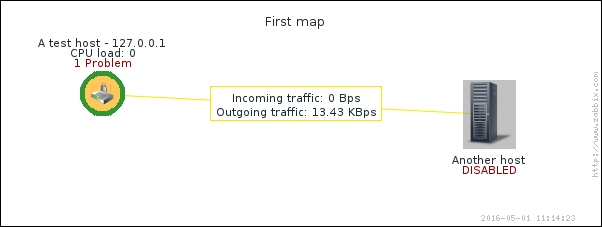
Still, looking at the Y axis in that graph, we see the incoming values being represented as a number without any explanation of what it is, and larger values get K, M and other multiplier identifiers applied. It would be so much better if Zabbix knew how to calculate it in bytes or a similar unit. Right, so navigate to Configuration | Hosts and click on Items next to Another host, and then click on the Incoming traffic on the eth0 interface in the NAME column. Edit the Units field and enter Bps, and then click on Update.
Let's check whether there's any improvement in the Monitoring | Latest data:
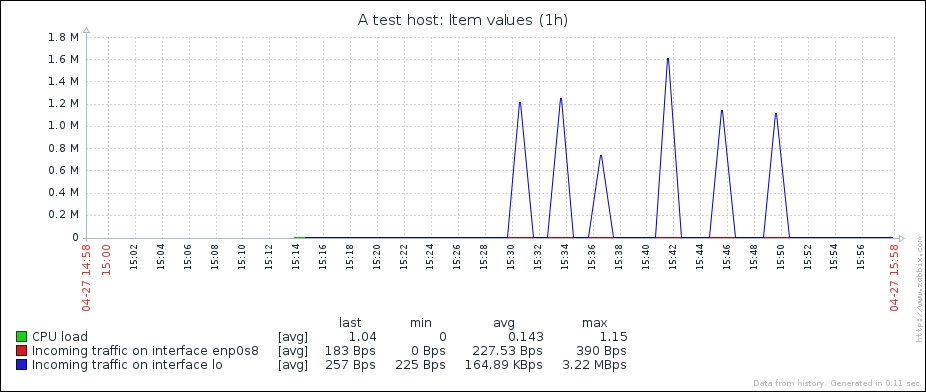
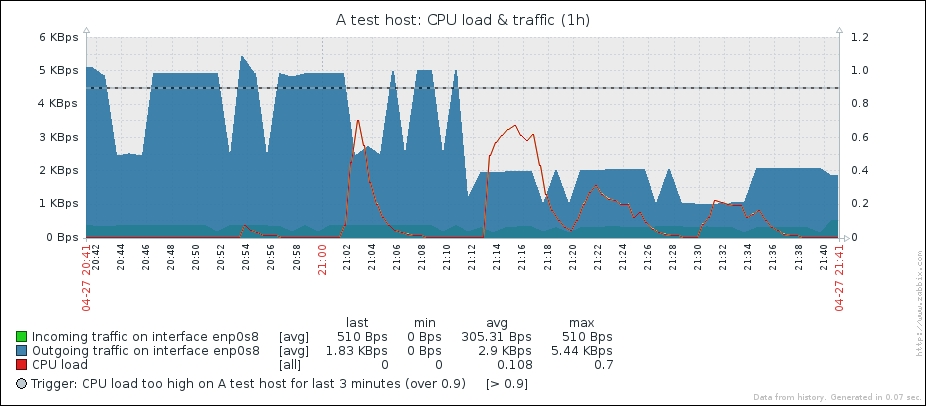
Wonderful; data is still arriving. Even better, notice how Zabbix now automatically calculates KB, MB, and so on where appropriate. Well, it would in our example host if there were more traffic. Let's look at the network traffic; click on Graph:
Take a look at the Y axis—if you have more traffic, units will be calculated there as well to make the graph readable, and unit calculations are retroactively applied to the previously gathered values.
Note
Units do not affect stored data like the Store value option did, so we do not have to clear the previous values this time.
One parameter that we set, the update interval, could have been smaller, thus resulting in a better-looking graph. But it is important to remember that the smaller the intervals you have on your items, the more data Zabbix has to retrieve, and each second, more data has to be inserted into the database and more calculations have to be performed when displaying this data. While it would have made no notable difference on our test system, you should try to keep intervals as large as possible.
So far, we have created items that gathered numeric data—either integers or decimal values. Let's create another one, a bit different this time. As usual, go to Configuration | Hosts and click on Items next to Another host. Before continuing with item creation, let's look at what helpful things are available in the configuration section, particularly for items. If we look above the item list, we can see the navigation and information bar:
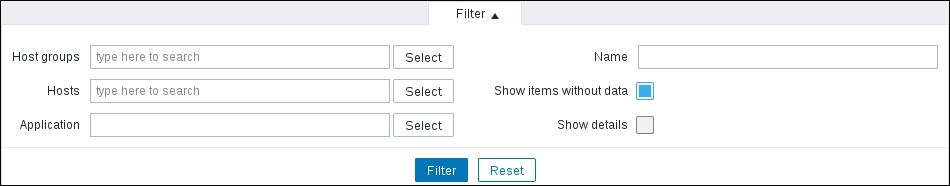
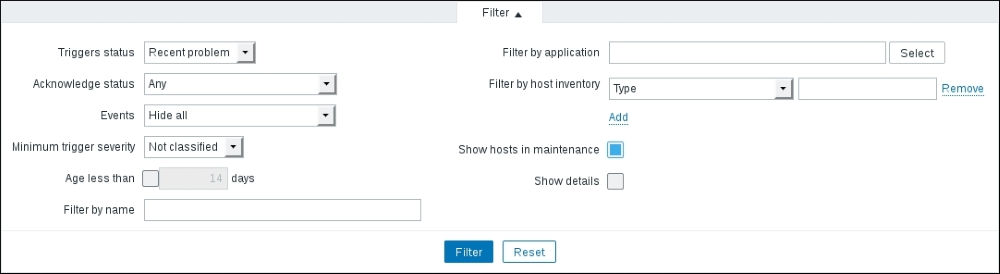
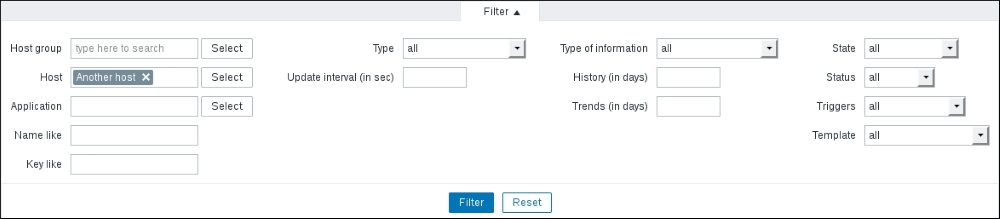
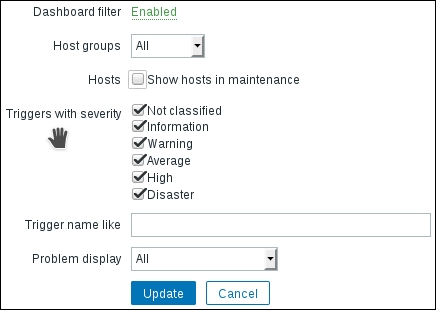
This area provides quick and useful information about the currently selected host: the hostname, whether the host is monitored, and its availability. Even more importantly, on the right-hand side, it provides quick shortcuts back to the host list and other elements associated with the current host: applications, items, triggers, graphs, discovery rules, and web scenarios. This is a handy way to switch between element categories for a single host without going through the host list all the time. But that's not all yet—click on the Filter button to open the filter we got thrown in our face before. The sophisticated filter appears again:
Using this filter, we can make complex rules about what items to display. Looking at the top-left corner of the filter, we can see that we are not limited to viewing items from a single host; we can also choose a Host group. When we need to, we can make filter choices and click on the Filter link underneath. Currently, it has only one condition: the Host field contains Another host, so the Items link from the host list we used was the one that set this filter. Clear out the Host field, choose Linux servers from the Host group field, and click on the Filter button below the filter.
Note
Host information and the quick link bar is only available when items are filtered for a single host.
Now, look right below the main item filter—that is a Subfilter, which, as its header informs, only affects data already filtered by the main filter.
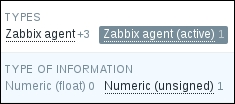
The entries in the subfilter work like toggles—if we switch one on, it works as a filter on the data in addition to all other toggled subfilter controls. Let's click on Zabbix agent (active) now. Notice how the item list now contains only one item—this is what the number 1 represented next to this Subfilter toggle. But the subfilter itself now also looks different:
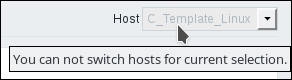
The option we enabled, Zabbix agent, has been highlighted. Numeric (float), on the other hand, is greyed out and disabled, as activating this toggle in addition to already active ones results in no items being displayed at all. While the Numeric (unsigned) toggle still has 1 listed next to it, which shows that enabling it will result in those many items being displayed, the Zabbix agent toggle instead has +3 next to it. This form represents the fact that activating this toggle will display three more items than are currently being displayed, and it is used for toggles in the same category. Currently, the subfilter has five entries, as it only shows existing values. Once we have additional and different items configured, this subfilter will expand. We have finished exploring these filters, so choose Another host from the Host field, click on the Filter button under the filter, and click on Create item.
When you have many different hosts monitored by Zabbix, it's quite easy to forget which version of the Zabbix agent daemon each host has, and even if you have automated software deploying in place, it is nice to be able to see which version each host is at, all in one place.
Use the following values:
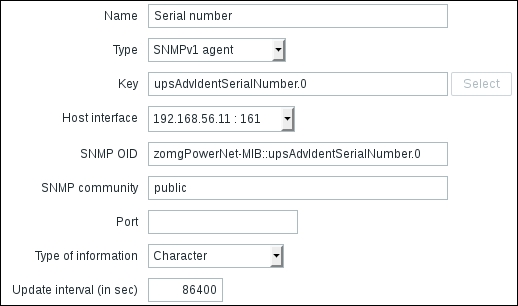
Name: Enter Zabbix agent version
Type: Select Zabbix agent (active) (we're still creating active items)
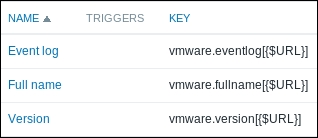
Key: Click on Select and then choose the third entry from the list—agent.version
Type of information: Choose Character
Update interval (in sec): Enter 86400
When done! Click on the Add button. There are two notable things we did. Firstly, we set the information type to Character, which reloaded the form, slightly changing available options. Most notably, fields that are relevant for numeric information were hidden, such as units, multiplier, and trends.
Secondly, we entered a very large update interval, 86400, which is equivalent to 24 hours. While this might seem excessive, remember what we will be monitoring here—the Zabbix agent version, so it probably (hopefully) won't be changing several times per day. Depending on your needs, you might set it to even larger values, such as a week.
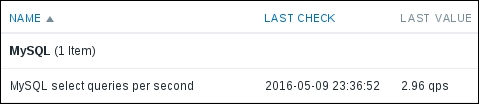
To check out the results of our work, go to Monitoring | Latest data:
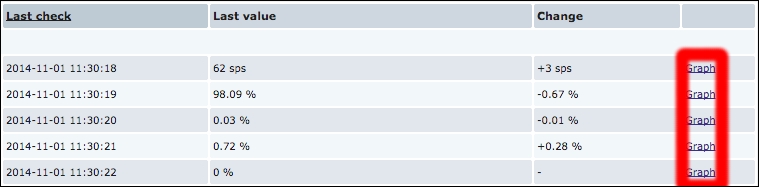
If you don't see the data, wait a while; it should appear eventually. When it does, you should see the version of the Zabbix agent installed on the listed remote machine, and it might be a higher number than displayed here, as newer versions of Zabbix have been released. Notice one minor difference: while all the items we added previously have links named Graph on the right-hand side, the last one has one called History. The reason is simple: for textual items, graphs can't be drawn, so Zabbix does not even attempt to do that.
Now, about that waiting—why did we have to wait for the data to appear? Well, remember how active items work? The agent queries the server for the item list it should report on and then sends in data periodically, but this checking of the item list is also done periodically. To find out how often, open the zabbix_agentd.conf configuration file on the remote machine and look for the RefreshActiveChecks parameter. The default is 2 minutes, which is configured in seconds, thus listing 120 seconds. So, in the worst case, you might have had to wait for nearly 3 minutes to see any data as opposed to normal or passive items, where the server would have queried the agent as soon as the configuration change was available in its cache. In a production environment with many agents using active items, it might be a good idea to increase this value. Usually, item parameters aren't changed that often.
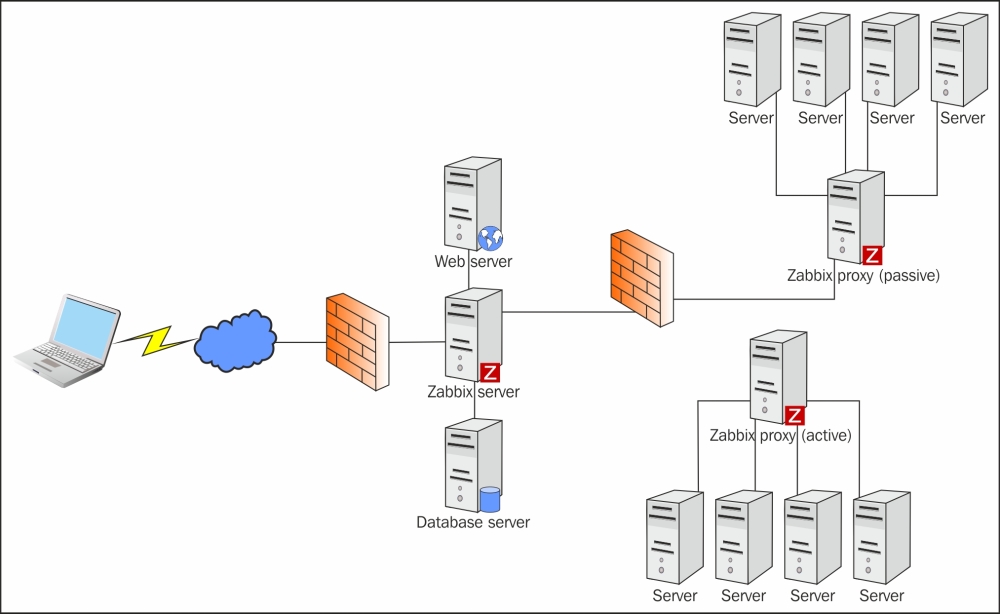
Choosing between active and passive items
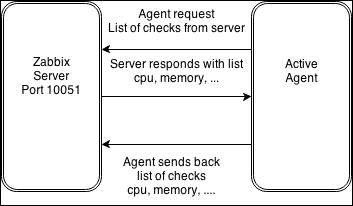
Even though we discussed Zabbix agents being active or passive, an agent really is neither one nor the other: the direction of the connections is determined by the item level. An agent can (and, by default, does) work in both modes at the same time. Nevertheless, we will have to choose which item type—active or passive—to use. The short version: active items are recommended.
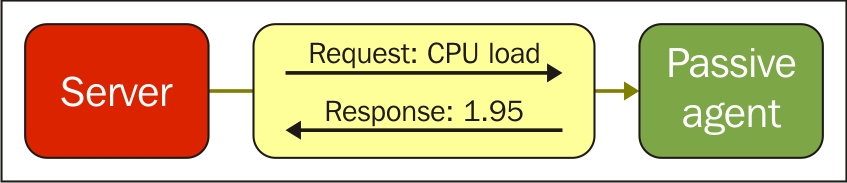
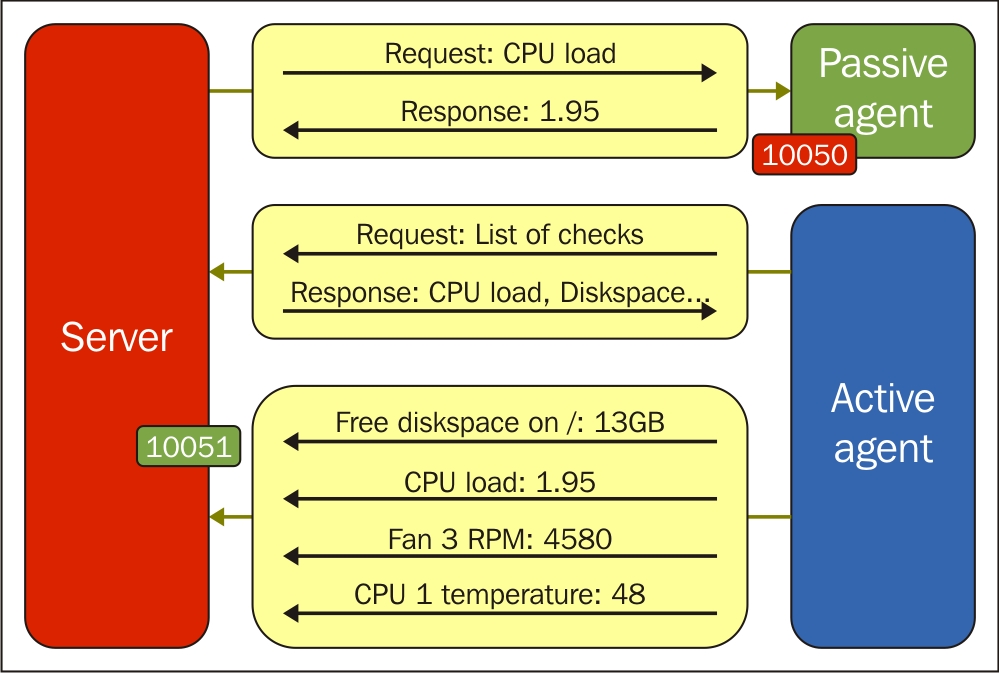
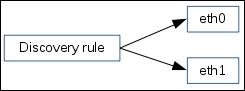
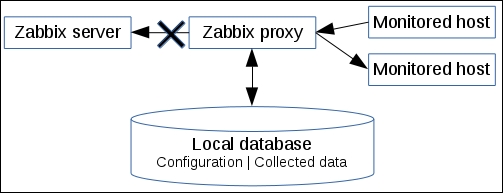
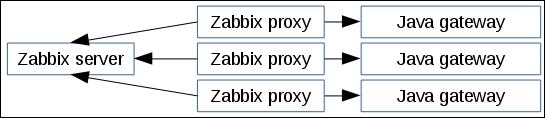
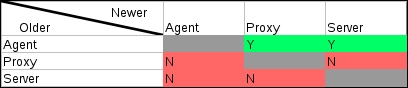
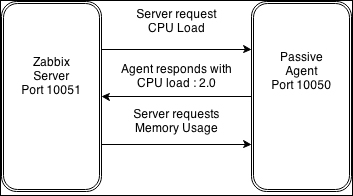
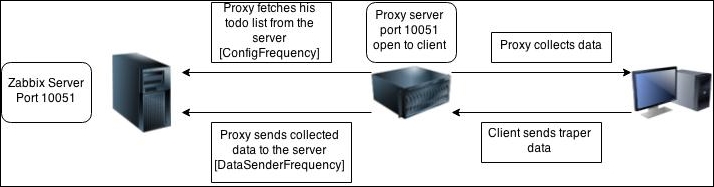
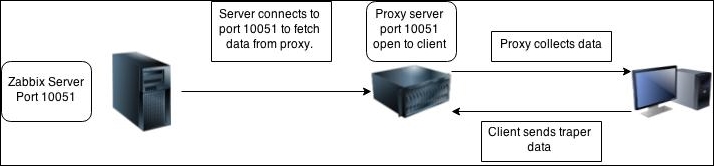
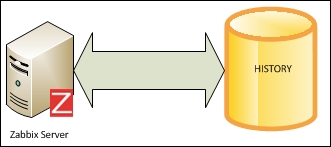
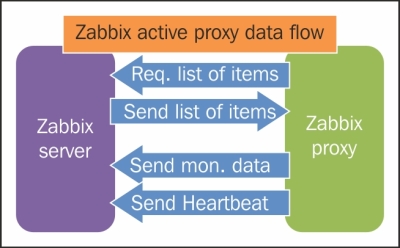
To understand why, let's compare how the connections are made. With a passive agent, it is very simple:
Note
The arrow direction denotes how connections are made.
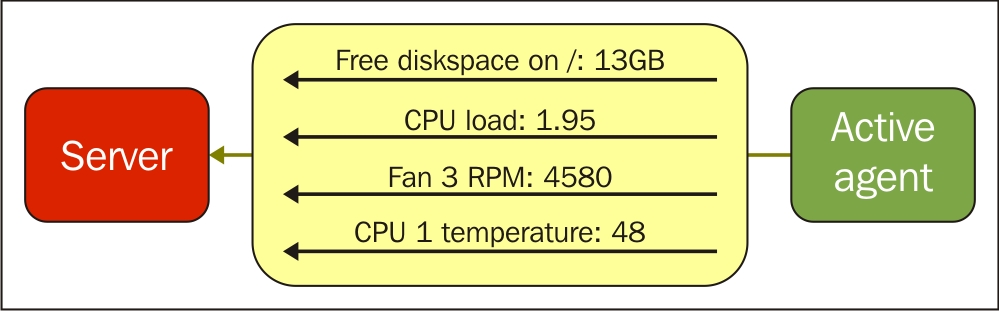
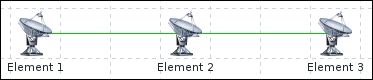
One value means one connection. An active agent is a bit more complicated. Remember: in the active mode, the agent connects to the server; thus, the agent first connects to the Zabbix server and asks for a list of items to be monitored. The server then responds with items, their intervals, and any other relevant information:
At this point, the connection is closed and the agent starts collecting the information. Once it has some values collected, it sends them to the server:
Note that an active agent can send multiple values in one connection. As a result, active agents will usually result in a lower load on the Zabbix server and a smaller amount of network connections.
The availability icon in the host list represents passive items only; active items do not affect it at all. If a host has active items only, this icon will stay grey. In previous Zabbix versions, if you added passive items that failed and then converted them all to active items, this icon would still stay red. Zabbix 3.0.0 is the first version in which the icon is automatically reset back to grey.
Of course, there are some drawbacks to active items and benefits to passive items too. Let's try to summarize what each item type offers and in which situation they might be better.
The benefits of active items are as follows:
They have a smaller number of network connections
They cause lower load on the Zabbix server
They will work if the network topology or firewalls do not allow connecting from the server to the agent (for example, if the monitored hosts are behind a NAT)
Items such as log or Windows event log monitoring are supported
Here are the benefits of passive items:
They are easier to set up for beginners
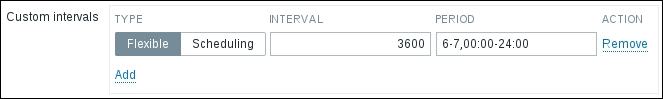
Custom intervals are supported (they are not supported by active items)
Polling a virtual IP address on a cluster allows you to always query the active cluster node
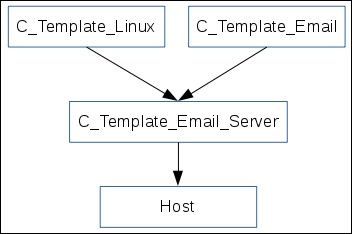
The default templates use passive items; thus, no modification or other configuration is required to use them
We will discuss using and modifying templates in Chapter 8, Simplifying Complex Configuration with Templates.
Earlier, we discussed what introduces delay before a new item is checked: the Zabbix server configuration cache was mentioned. For passive items, there is another factor involved as well, and it is the way Zabbix schedules items to be polled. Each item is scheduled to be polled at a certain time, and the time between two polls is always constant. Even more, a specific item is always scheduled the same way, no matter when the Zabbix server was started. For example, if an item has a 60-second interval, it could be configured to be polled at second 13 of every minute. If the Zabbix server is restarted, this item will still be polled at second 13 of every minute. This scheduling is based on an
internal item ID; thus, a specific item will not get this timing changed during its lifetime unless it is deleted and recreated or the item interval is changed.
Note
This logic is similar for all polled item types and will be relevant when we configure SNMP and other item types.
Active items get their polling started upon agent startup; thus, the specific time when values arrive will change based on when the agent was started. Additionally, active items are processed in a serial fashion; thus, one slow item can delay the values for other items from the same agent.
To summarize, after we add a new passive item, it is saved in the database—the Zabbix server does not know about it yet. This item is then loaded into the configuration cache. The configuration cache is refreshed every 60 seconds by default. After the server finds out about the new item, it schedules the item to be polled for the first time at some point between that moment and the item interval.
This means that with the default interval of 30 seconds, it may take from 30 to 90 seconds before the first value arrives for the item. If the item has a very long interval, such as a serial number or agent version configured earlier, it may take a very long time until the first value appears automatically. There is no way to speed up item polling except by adding it with a short interval at first and then increasing the interval when the item has been verified to work as expected.
After a new active item is added, it is saved in the database again and the Zabbix server does not know about it yet. The active Zabbix agent periodically connects to the server to gather information about items it is supposed to monitor, but as it is not in the configuration cache yet, the server does not tell the agent about the item. This item is then loaded into the configuration cache. The configuration cache is refreshed every 60 seconds by default. After the server finds out about the new item, the item is available to the agent, but the agent connects to the server every 2 minutes by default. Once the agent finds out about the new item, it immediately attempts to collect the first value for it.
Note
Refer Chapter 22, Zabbix Maintenance, for details on how to tune these intervals.
In both cases, if an item is set to delta, we have to obtain two values before we can compute the final value that will be stored in the database and displayed in the frontend—we can't compute the difference from just one value.