An introduction to PuppetDB and exported resources
PuppetDB is a database service that is used to store and query information of Puppet Agents. It typically runs on the Puppet Master node, but it can also be installed on a separate database server for performance and/or security reasons.
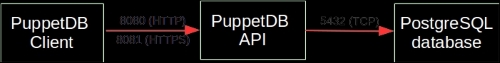
PuppetDB consists of two key components:
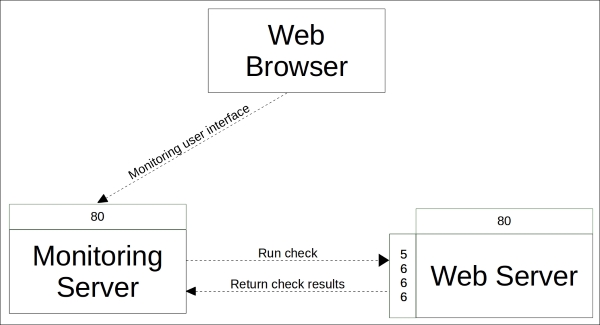
The software that provides the SQL database is called PostgreSQL, which is a popular open source database project. The PostgreSQL process listens on the TCP port 5432 for the incoming connections from the API. Although the PostgreSQL database can be accessed directly from client software, it is not recommended. Instead, the connection to PuppetDB should always be done via the API. PuppetDB API exposes the information from the SQL database to the API clients via the HTTP protocol, and it is also used by Puppet to query and store the information in the database. PuppetDB API comes with a built-in web server called Jetty that listens on TCP ports 8080 (HTTP) and 8081 (HTTPS).
The connectivity from the PuppetDB Client to the PostgreSQL database via PuppetDB API can be illustrated with the following diagram:
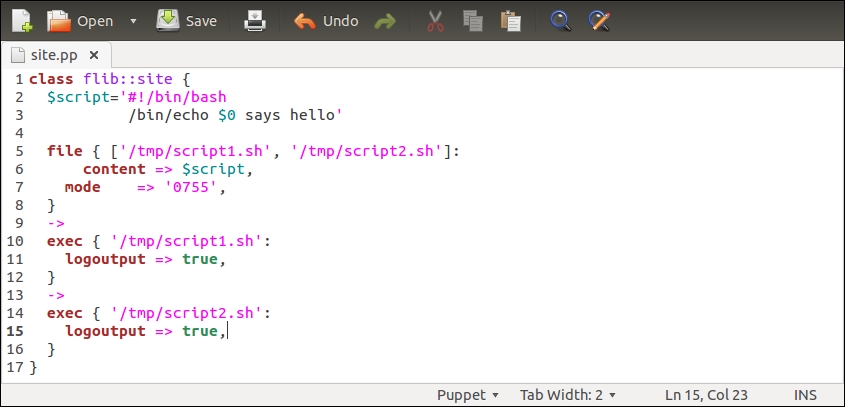
One of the services that PuppetDB provides is called exported resources, also known as storeconfigs. Exported resources enable the Puppet Agent nodes to exchange resources between them by exporting a resource on one node and importing the resource to another node. We can export any type of a Puppet resource, including the custom types. In this chapter, we will learn how to export and import the built-in resource types, nagios_host and nagios_service.
Before we dive into this, let's briefly take a look at the benefits of using exported resources.
Exported resources are useful when configuring a cluster of nodes that share services between them, and the nodes need to be able to discover services from each other automatically. If the formation of the cluster is static (a fixed number of nodes in the cluster), its configuration can be managed without exported resources. However, clusters these days are not static but dynamic. Modern clusters are scaled up and down according to demand. To manage a configuration that can adjust to changes as they happen, we need tools such as exported resources that dynamically adjust the configuration of the cluster.
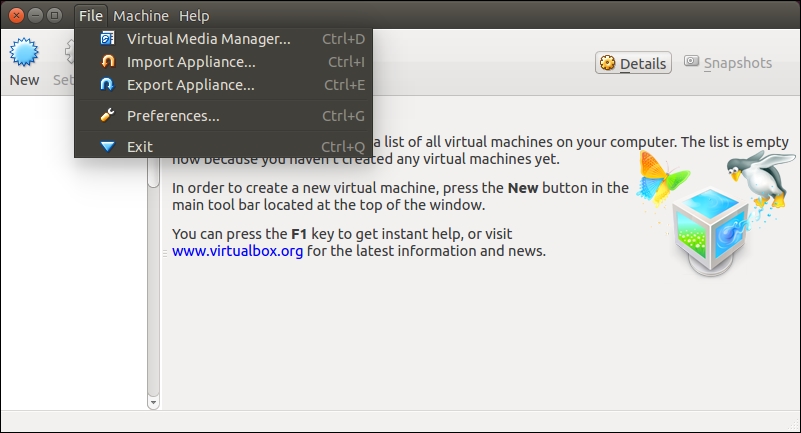
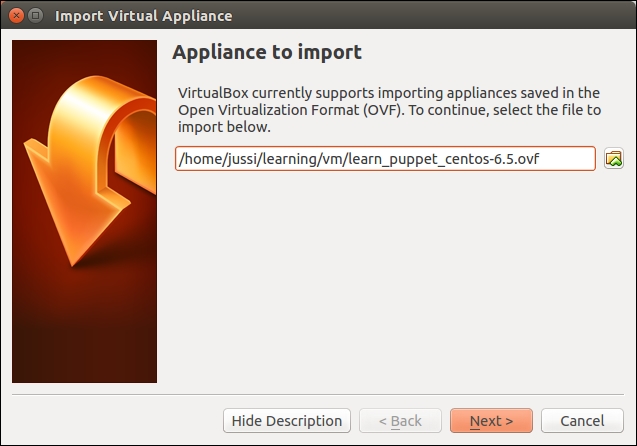
To demonstrate how exported resources enable you to turn a static configuration into a dynamic one, we will revisit the nagios module, which we created in Chapter 4, Monitoring Your Web Server, and modify it slightly.
Exporting and importing resources
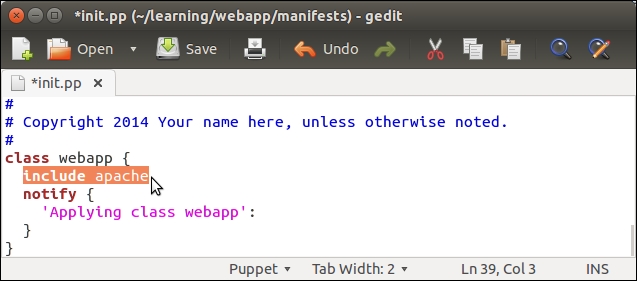
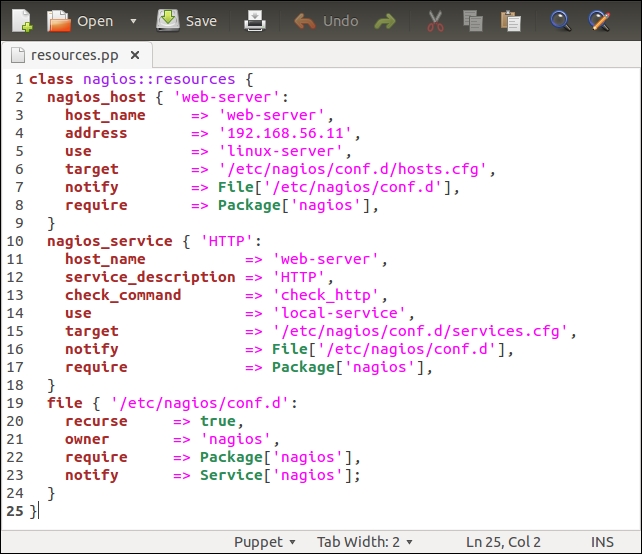
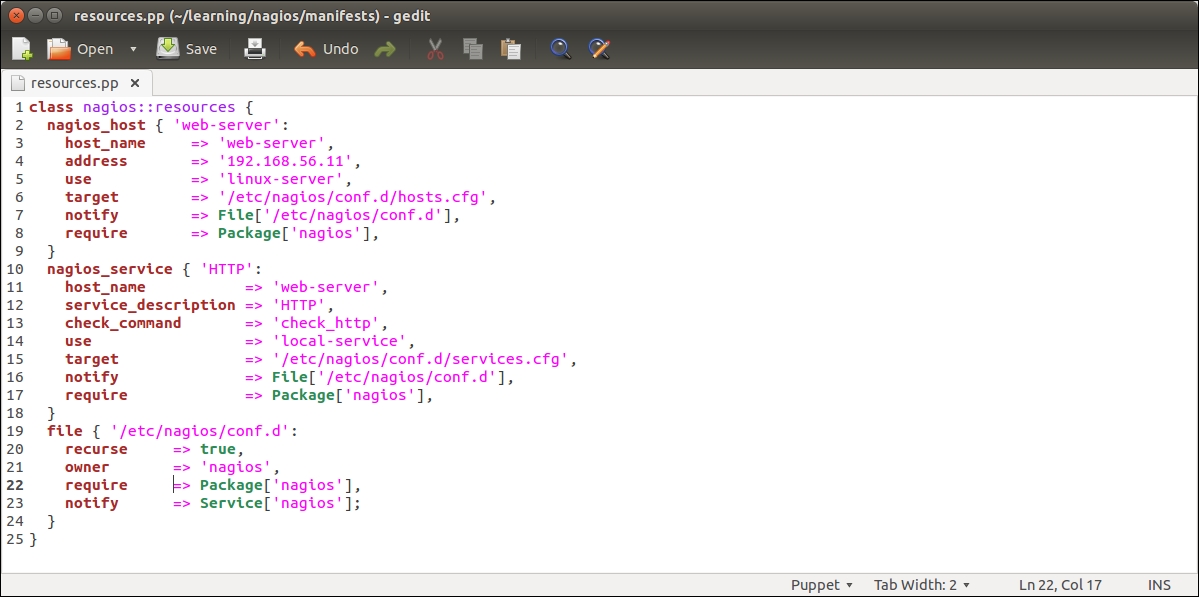
Before we add logic to export and import resources, let's take a look at the nagios::resources class in its current form:
Lines 2 to 9 include the nagios_host definition of our web server. The nagios_service resource on lines 10 to 18 defines the HTTP monitoring check, which is associated with the web server node.
This configuration works fine as long as the web server node uses the IP address 192.168.56.11 (set by the address attribute on line 4). When the IP address of the web server changes, or we add another web server for monitoring, we are required to manually update the manifest to reflect the changes in the cluster.
A better way to do this is to make the nagios_host and nagios_service resources as exported resources, and let the nagios server node import them. This way, the resources get automatically updated when the IP address changes or when we add more nodes to the cluster, and we don't have to manually update the manifest every time the change happens.
To achieve this, we are going to move the nagios_host and nagios_service resources to a new class called nagios::check_http, and make the resources exported.
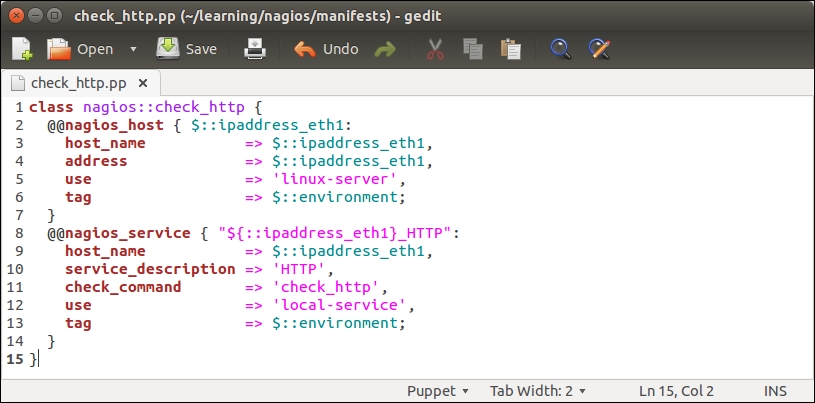
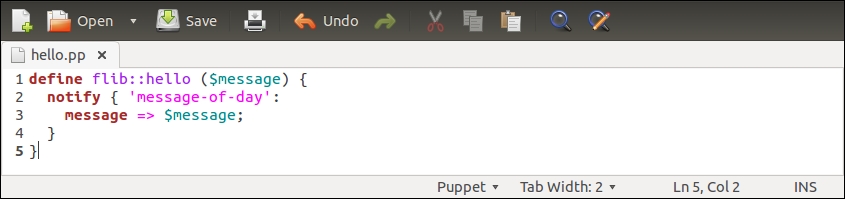
Let's create a new file called check_http.pp under the nagios/manifests directory, and declare a nagios::check_http class with the following content:
Note
You can cut lines 2 to 18 from the nagios::resources class, paste them into the nagios::check_http class, and remove the target, notify, and require attributes.
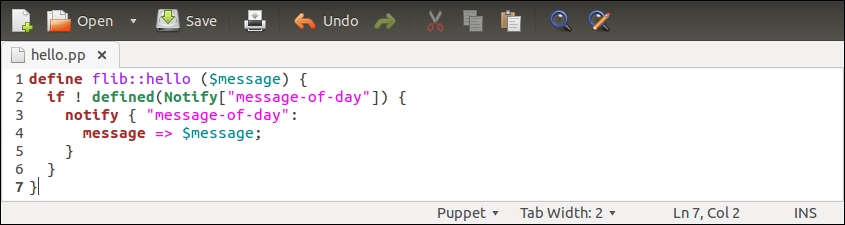
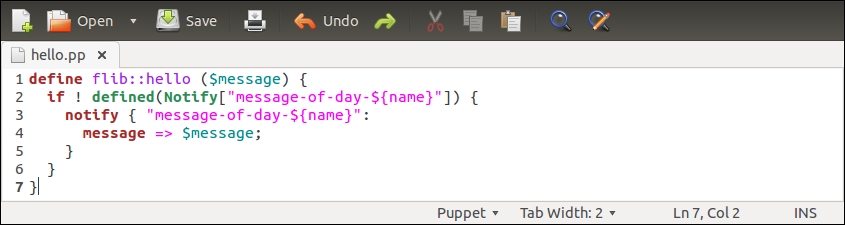
The nagios::check_http class declares the nagios_host and nagios_service resources that are exported. To export a resource, we prefix the type with a double at sign notation, as in @@nagios_host and @@nagios_service.
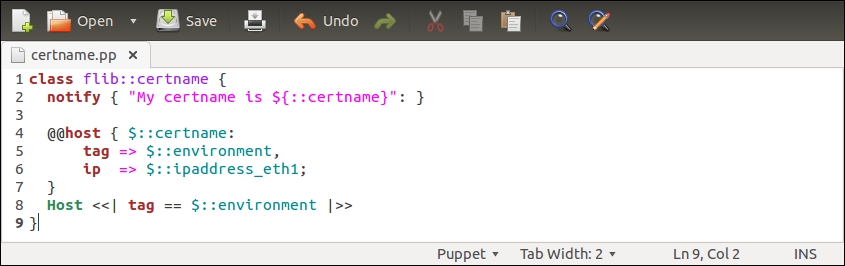
Let's take a look at the nagios::check_http class more in detail:
Line 1 begins with the nagios::check_http class definition.
Line 2 declares an exported resource @@nagios_host.
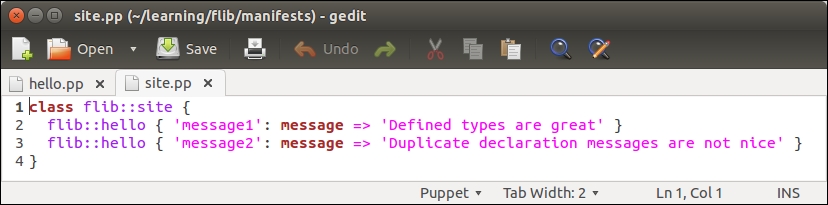
The name of the resource is a reference to facter ipaddress_eth1. The reason why we use facter as the exported resource name is because the name of the resource must be unique for every resource that is exported. If we use a fixed string, for example, web-server, for the resource name, this would cause a Duplicate declaration error when the resources are collected from more than one node. Using facter ipaddress_eth1 as the resource name, we can be sure that the resource name is unique when multiple nodes export the same resource.
Lines 3 and 4 set the host_name and address attribute values based on facter ipaddress_eth1.
Line 5 associates nagios_host with the host template called linux-server.
Line 6 introduces a tag attribute, which is often used with exported resources.
We tag the nagios_host resource with the name of the Puppet environment (the ${::environment} variable reference) of the node that exports the resource. When the resource is imported, which we will do on the Nagios Server host shortly, we will use the tag as a filter to only collect the resources that are exported on hosts that belong to a specific environment.
Line 7 closes the nagios_host resource definition.
Line 8 declares another exported resource called nagios_service, which creates a Nagios HTTP check.
As every Puppet resource name must be unique, we construct a unique name by joining the value of facter ipaddress_eth1 and a string _HTTP. By creating a unique name this way, we can associate this check with multiple hosts and not have to worry about the resource name clashes.
Line 9 associates the check with the nagios_host resource.
Lines 10 to 12 define attributes that must be supplied with the nagios_command resource.
Refer to Chapter 4, Monitoring Your Web Server, for a description of the attributes.
Line 13 tags the nagios_service resources with the name of the environment.
Line 14 closes the nagios_service definition.
Line 15 closes the nagios::check_http class.
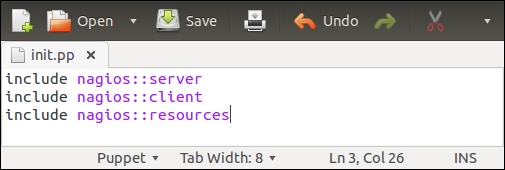
Once the nagios::check_http class has been created, save the file as check_http.pp under the manifests directory.
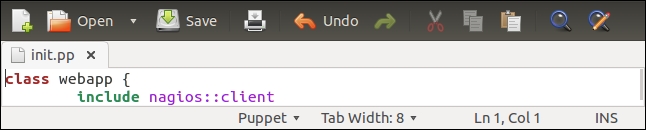
Then we need to associate the class with the web server node. You can choose whether you want to do it by adding an include nagios::check_http statement to the webapp class in the learning/webapp/manifests/init.pp file or by associating the nagios::check_http class via the node definition file learning/manifests/site.pp.
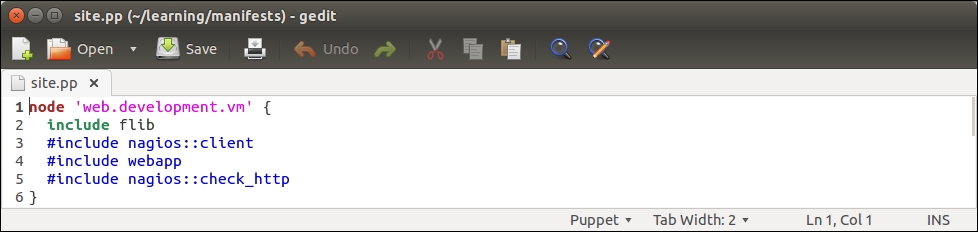
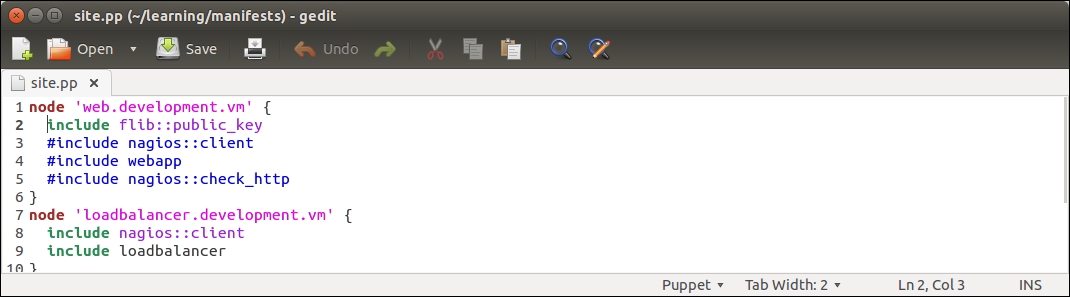
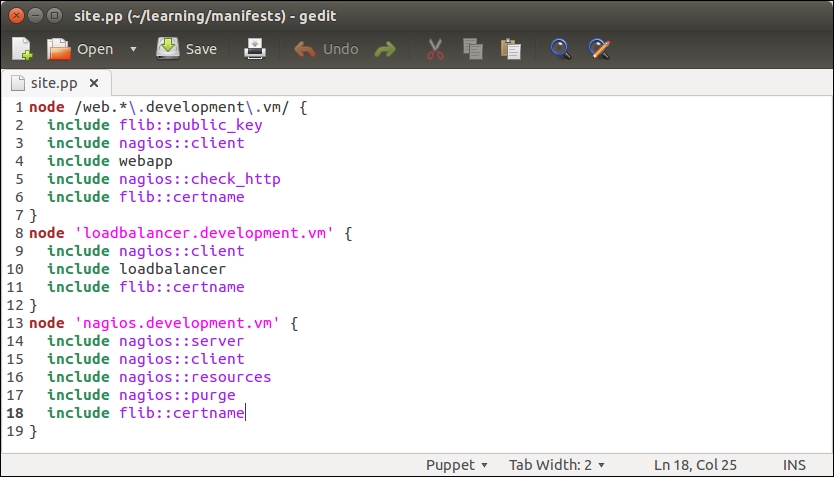
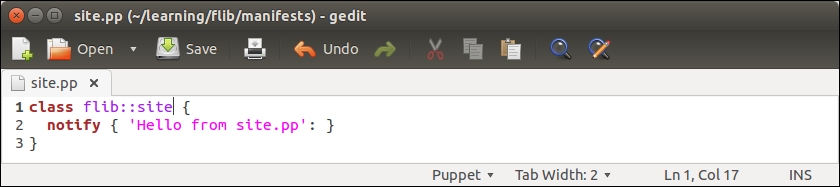
I would prefer to include the class in the node definition file learning/manifests/site.pp. This is how the definition of the web.learning.vm node will look like after I've associated the nagios::check_http class with the node on line 4:
Before we can see how exported resources work, we must configure a resource collector that imports the nagios_host and nagios_service resources from PuppetDB to the nagios server host. Importing resources is done with the Resource_type <<| tag == search_expression |>> syntax.
For example, to collect all the nagios_host resources that belong to our environment, we do it with the following statement:
The statement begins with a reference to the type of the resource we wish to collect. When referencing a Puppet resource, the resource type must begin with a capital letter (Nagios_host instead of nagios_host). After the resource type declaration, we have the so-called spaceship notation <<| |>> with an optional tag parameter inside it. Although the tag parameter is optional, I recommend that you use it; otherwise, the collection is done for every nagios_host resource that is stored in PuppetDB.
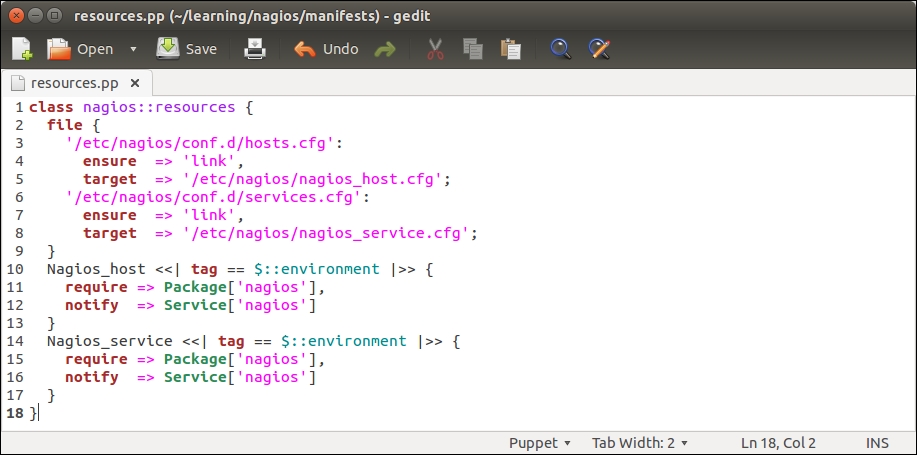
We can collect the exported nagios_host and nagios_service resources by altering the nagios::resources class in the file resources.pp file, as shown in the following screenshot:
The nagios::resources class contains two file resources and a resource for importing the nagios_host and nagios_service resources.
File resources (on lines 2 to 9) create the so-called symbolic links that are needed when purging Nagios resources with Puppet. We will cover Nagios resource purging in detail later in this chapter, but here is some background on why these symbolic links are needed.
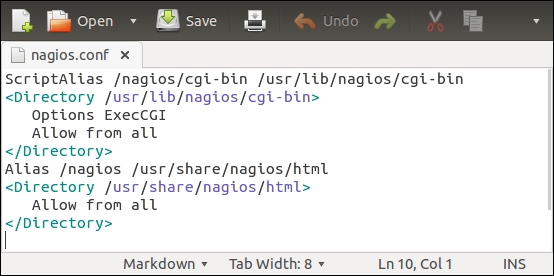
By default, Puppet stores the nagios_host resources in the /etc/nagios/nagios_host.cfg configuration file and the nagios_service resources in the /etc/nagios/nagios_service.cfg file. The issue with these file locations is that the nagios server does not process these files unless it is explicitly told to do so in the main nagios server configuration file, /etc/nagios/nagios.cfg. Symbolic links are created to workaround this problem.
By default, the nagios server processes all the files, including symbolic links, that have the .cfg file extension in the /etc/nagios/conf.d directory. To make Puppet play nicely with the default nagios server configuration, we create two links in the /etc/nagios/conf.d directory, which points to the /etc/nagios/nagios_host.cfg and /etc/nagios/nagios_service.cfg files.
Once the links are created, we declare the resource collection for the nagios_host and nagios_service resources.
Resource definitions for nagios_host and nagios_service that were previously present in this class have been replaced by the resource collectors for Nagios_host and Nagios_service.
There are two import statements:
Testing exported resources
Now that we have created the nagios::check_http class for exporting resources and a nagios::resources class that collects resources, we can test how the resource collection works in practice.
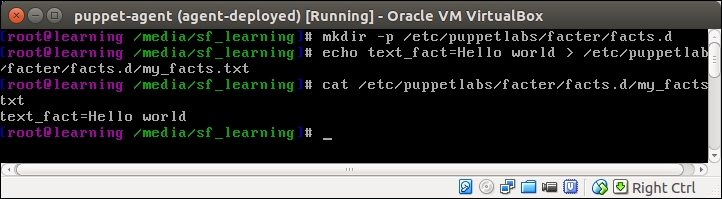
Before we apply manifests, let's move the /etc/nagios/conf.d/hosts.cfg and /etc/nagios/conf.d/services.cfg files to the /etc/nagios/ directory and rename them. This can be done by running the following two commands on the command line on the nagios server:
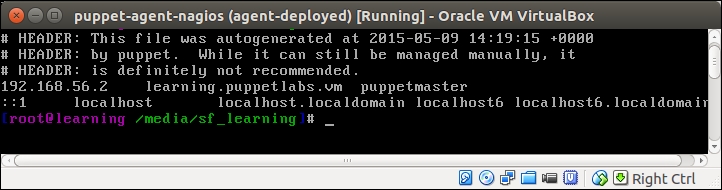
Here is a screenshot that shows you the output of the mv commands followed by the ls command to list the files in a new location:
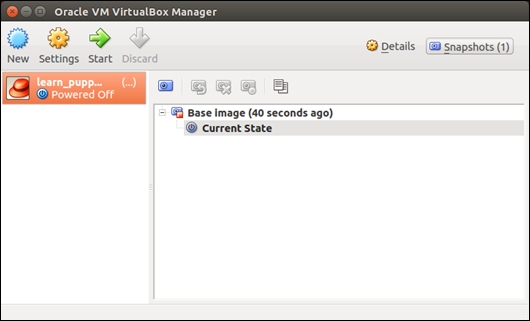
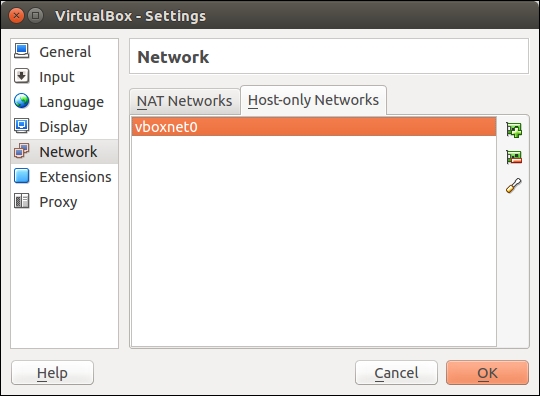
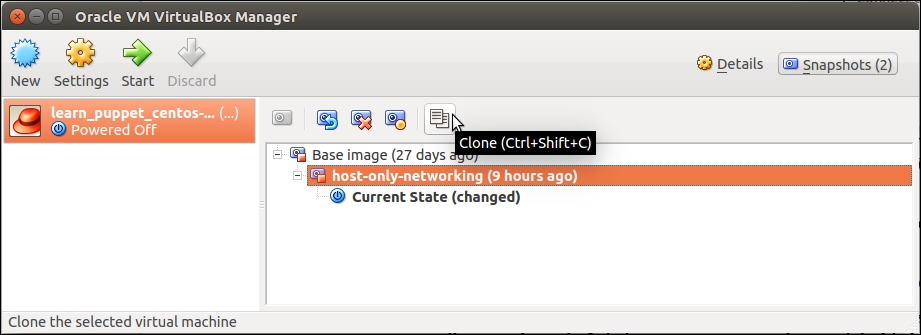
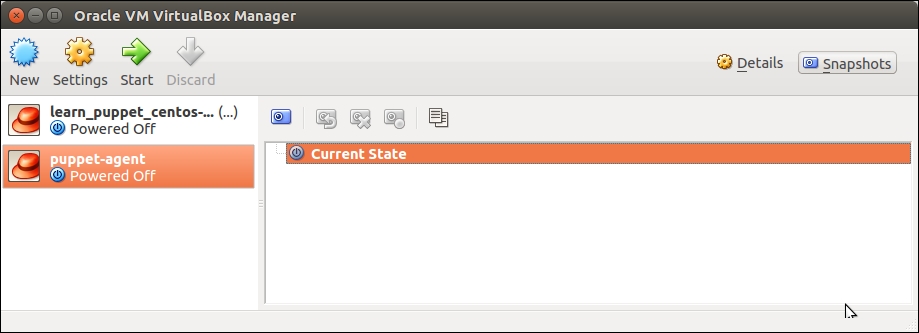
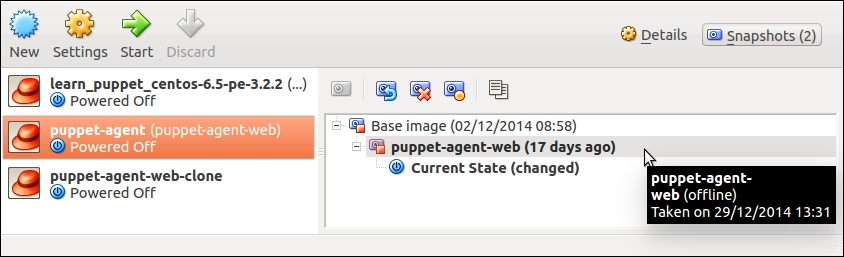
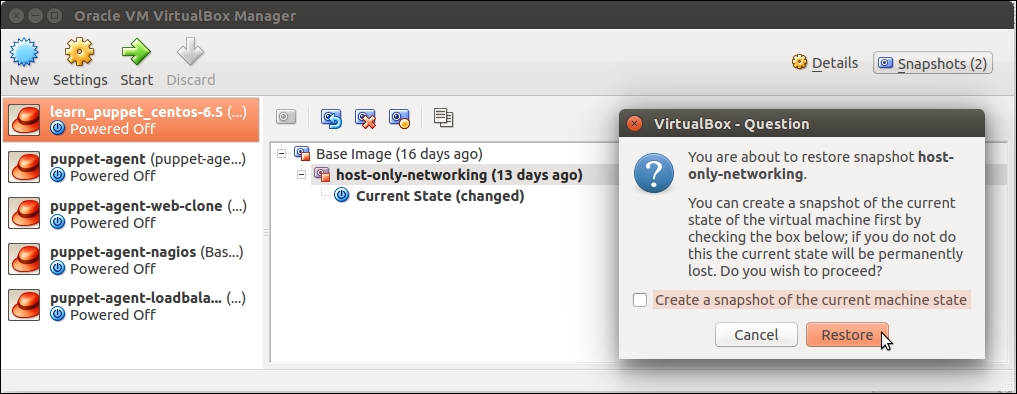
For testing, we need the following three virtual machines running:
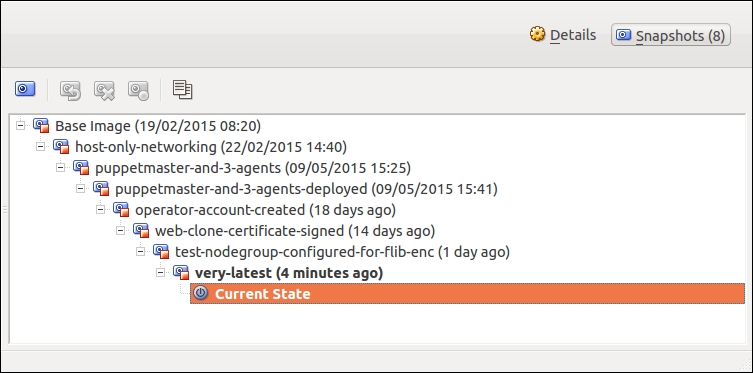
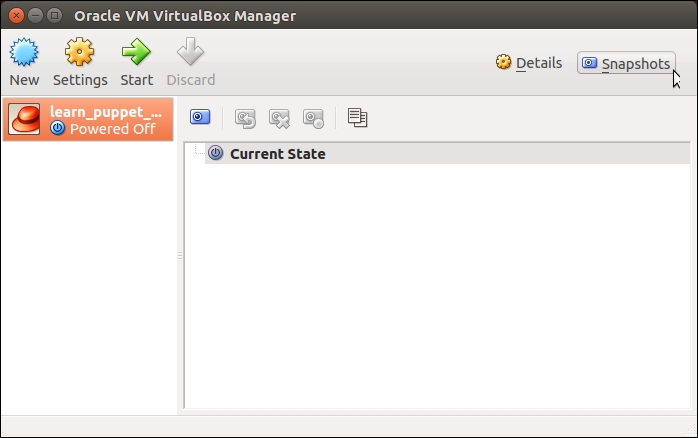
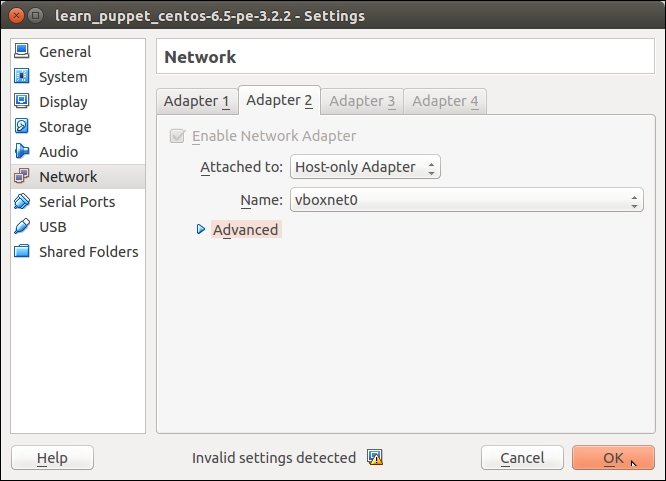
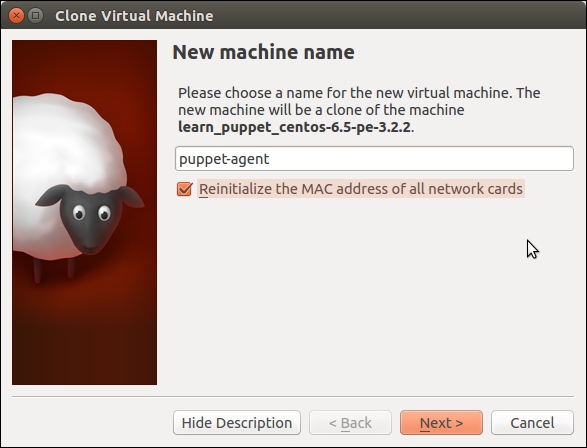
Puppet Master: It stores the exported resources in PuppetDB. This host is called learn_puppet_centos-6.5 in the VirtualBox Manager.
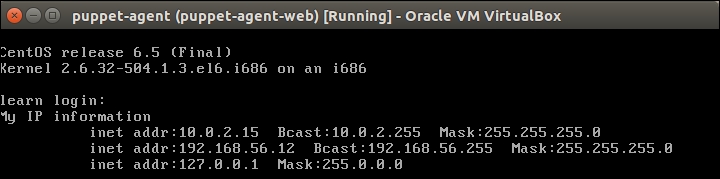
Web server: It exports the nagios_host and nagios_service resources. This host is called puppet-agent in the VirtualBox Manager.
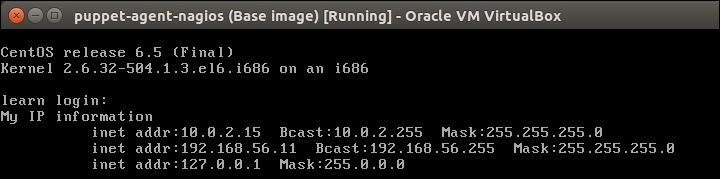
Nagios server: It imports resources from PuppetDB. This host is called puppet-agent-nagios in the VirtualBox Manager.
When working with exported resources, it is important to know in which order to run Puppet on nodes. For the nagios server node to successfully import resources from the web server node, the Puppet run that exports the resources must happen before the run that imports resources. As resources are exported on the web server node, we must run Puppet on it before we run Puppet on the nagios server node that imports resources.
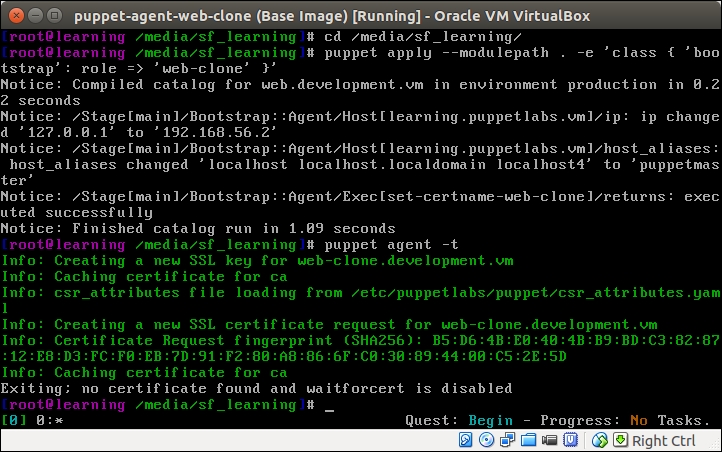
Run the puppet agent -t command on nodes in the following sequence:
The web server (puppet-agent).
The nagios server (puppet-agent-nagios).
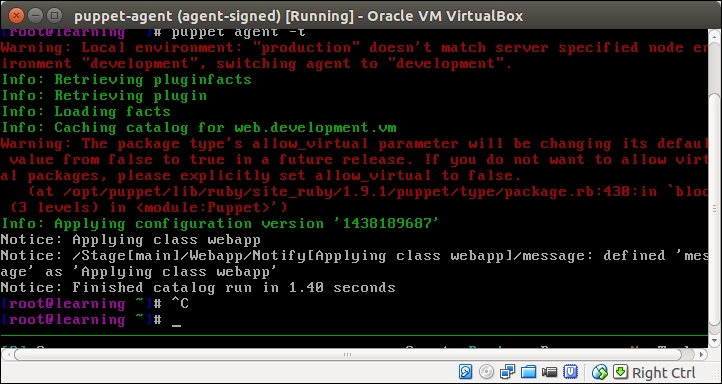
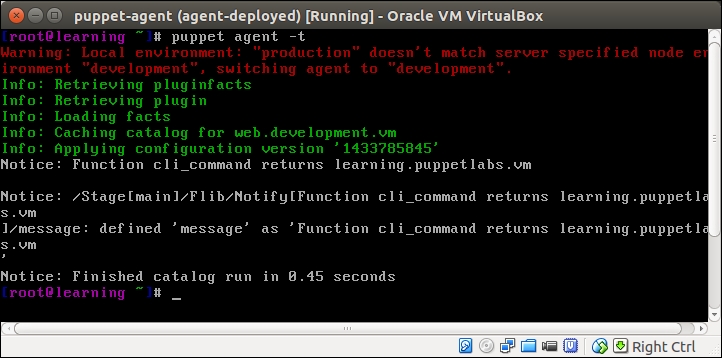
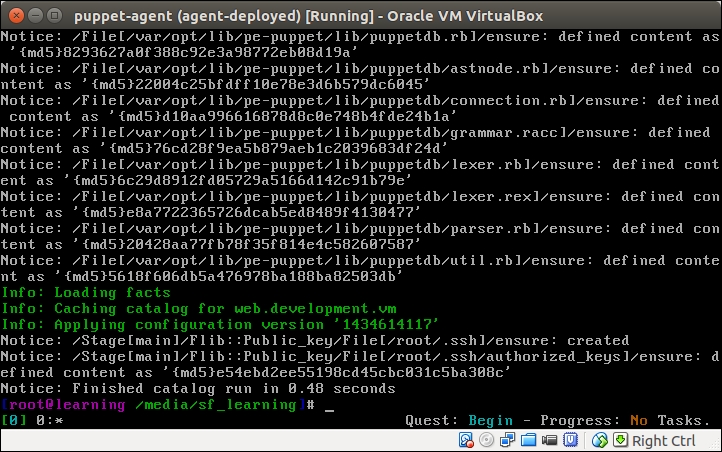
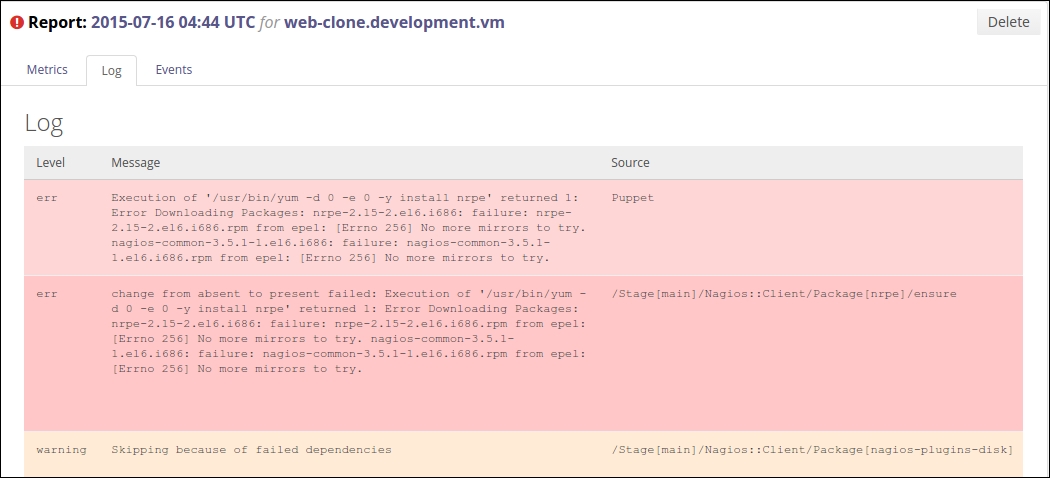
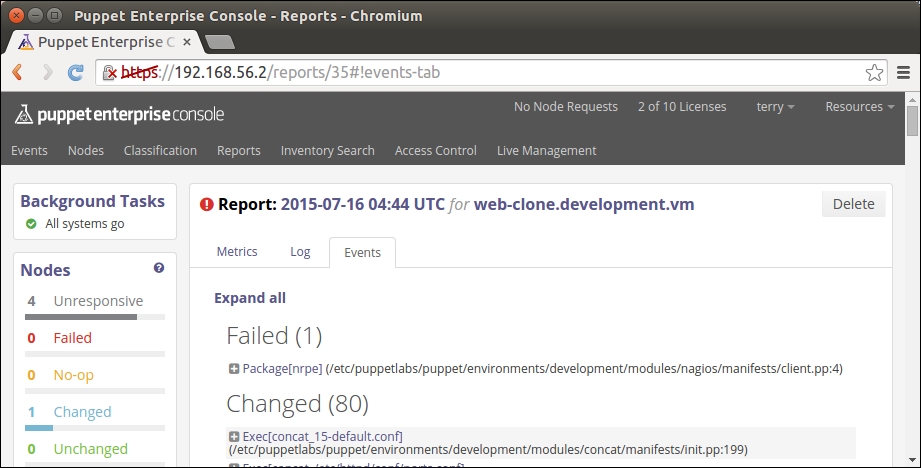
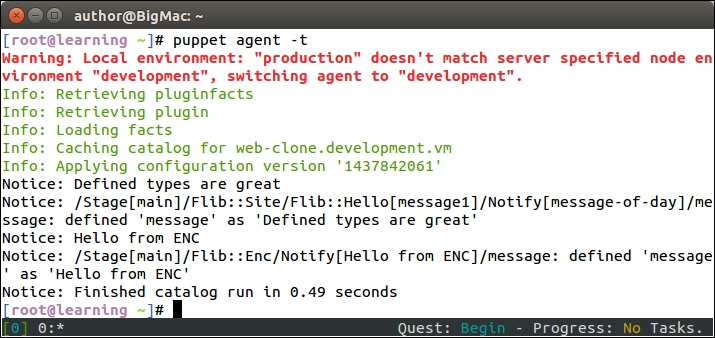
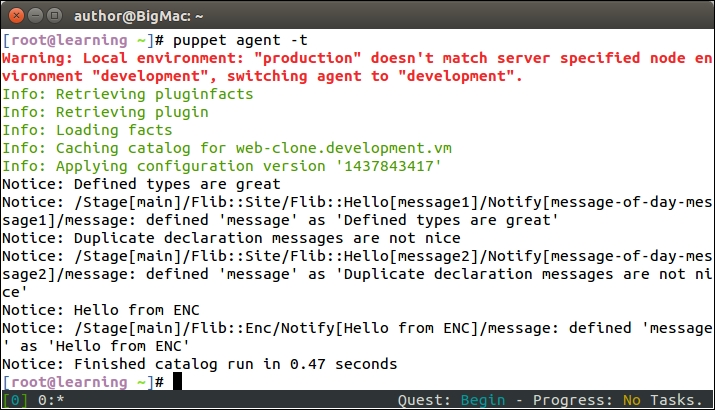
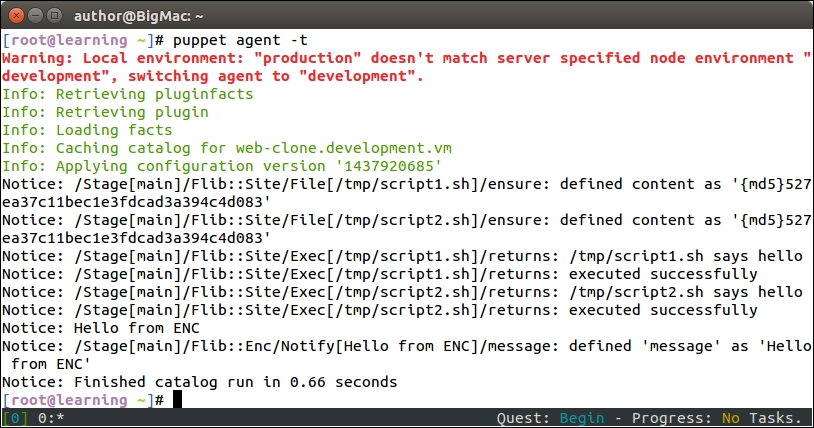
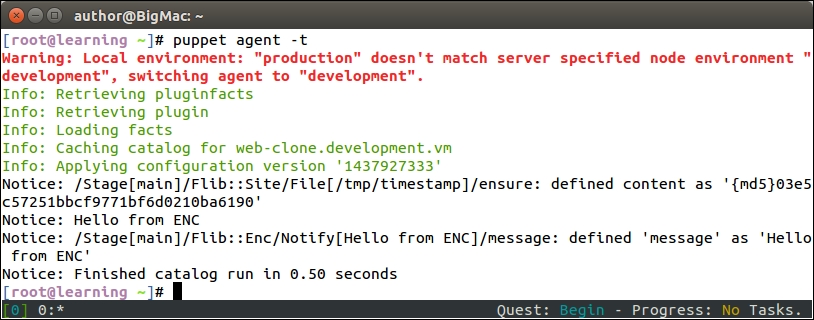
The Puppet run on the web server node doesn't show any nagios-related activity in the Puppet report but, when Puppet is run on the nagios server node, you will see the new Nagios_host and Nagios_service resources being imported on the server.
Here is a screenshot of the Puppet run that shows the resources that are imported on the nagios server:
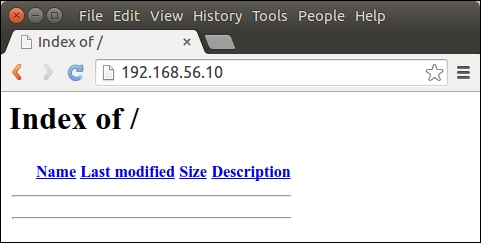
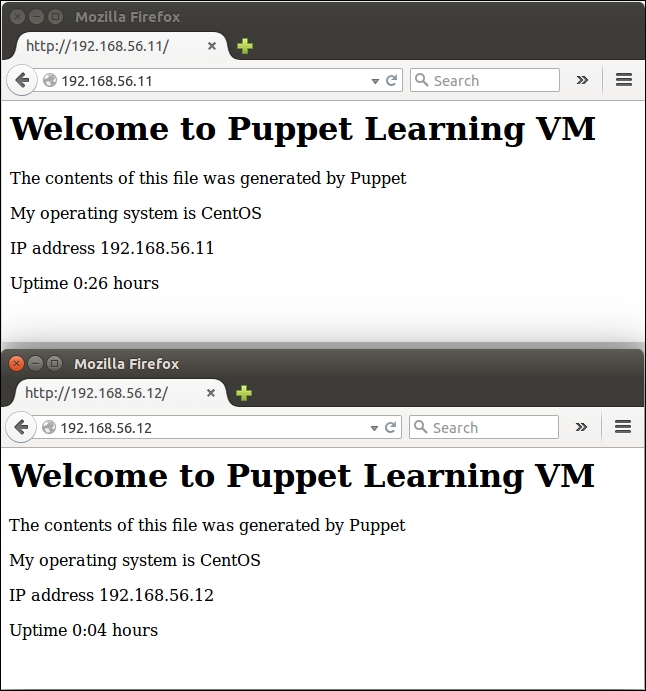
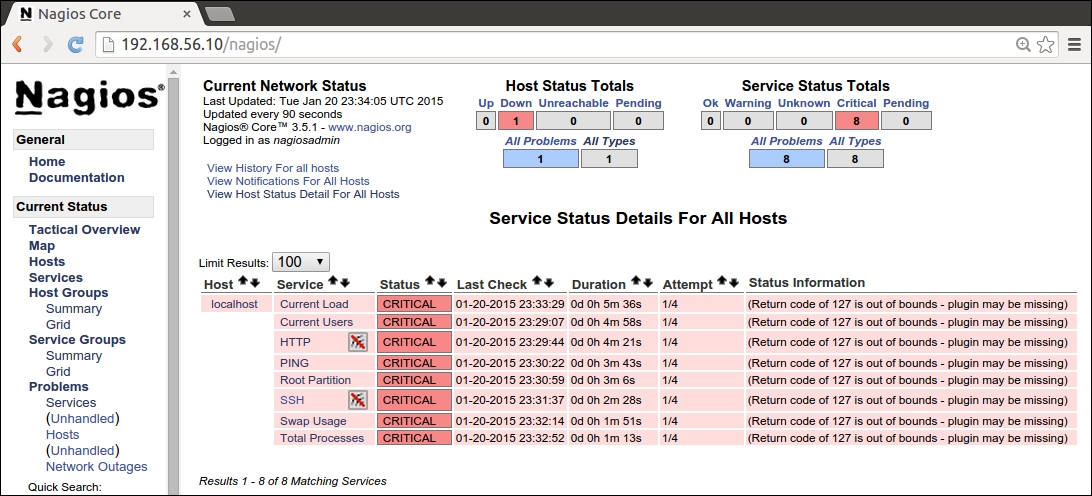
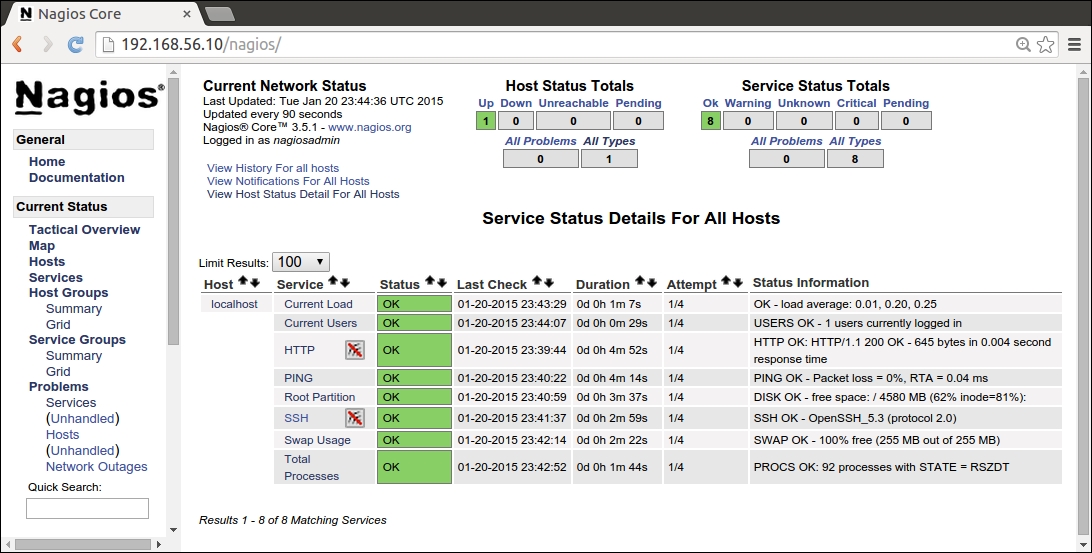
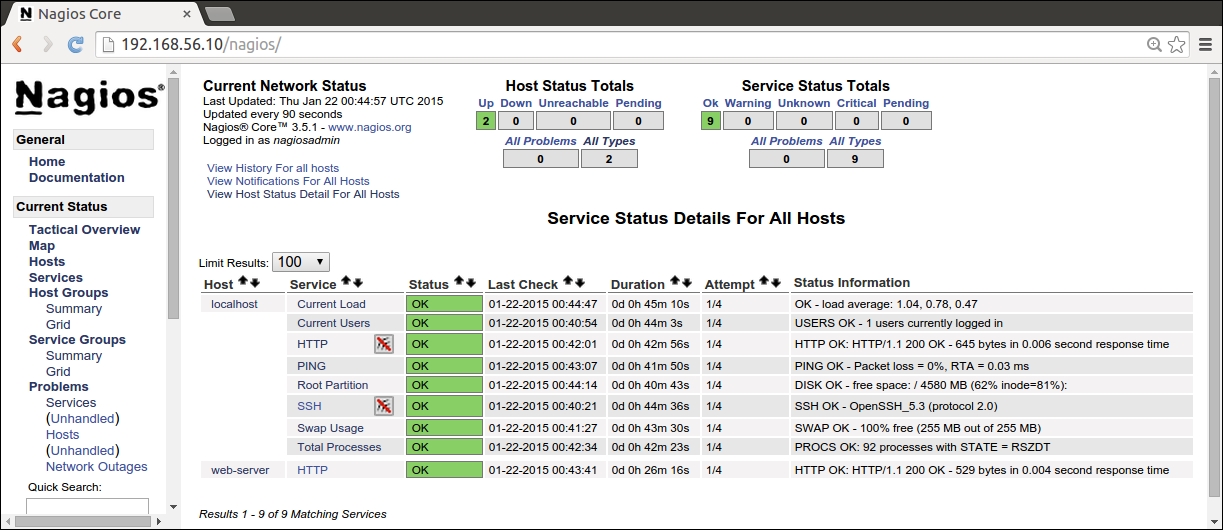
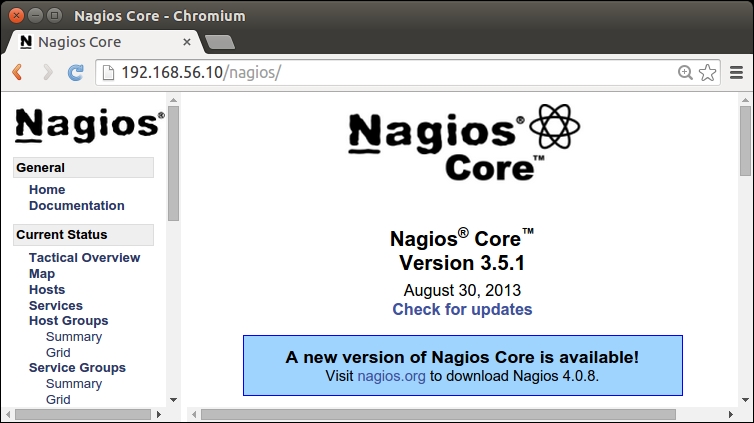
After the Puppet run is complete on the nagios server, open the nagios web interface at http://192.168.56.12/nagios. Click on the Services link in the navigation pane, which is on the left-hand side of the page, to list all the hosts, and check whether they are currently configured on the nagios server as shown in the following screenshot:.
The list should contain the following three hosts:
192.168.56.11: This is the web server host that we just created with the exported resources
localhost: This is the nagios server itself
web-server: This is the original nagios_host record that was created in Chapter 4, Monitoring Your Web Server
Note
If nagios throws an error message Whoops! Error: Could not read host and service status information!, when you click on the Services link, rerun puppet agent -t to start the nagios server process.
As you probably noticed that the Services view in the nagios web interface contains two nagios host resources for the web server. There is a resource for the host 192.168.56.11 that we created on the web server using exported resources a moment ago. There is also a resource for the nagios host called web-server, which was created in Chapter 4, Monitoring Your Web Server. Although we just removed the nagios_host record from the nagios::resources class and reran Puppet, the resource didn't get removed. Why is that?
The reason for this is because Puppet does not automatically remove resources when resources are removed from the manifest file. Instead, we have to explicitly tell Puppet to purge resources of a certain type that are no longer present in the manifests. Puppet has a special resource type called resources that can be used to purge resources that are no longer needed. To purge old resources using type resources, we can use the following syntax:
To purge the old nagios_host and nagios_service resources from the nagios server, we will create a new class that contains all the purging-related logic, and associate this class with the nagios server.
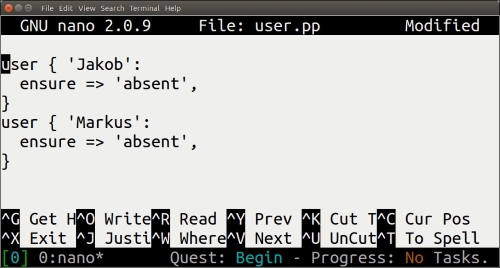
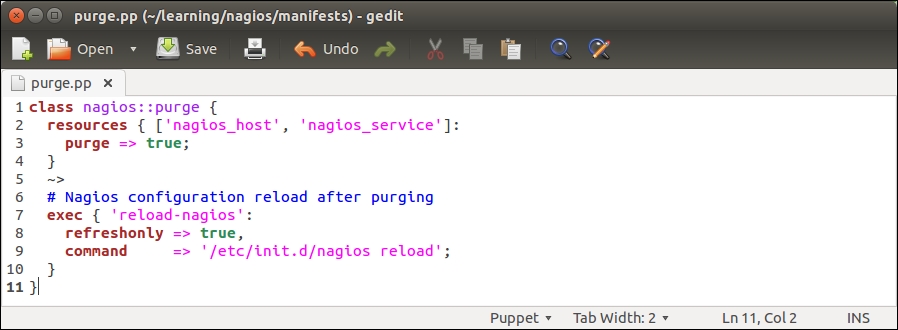
Let's create a new class called nagios::purge with the following content:
On lines 2 to 4, we declare a resource called resources that is applied to the nagios_host and nagios_service resource types. The resource contains a purge => true attribute that tells Puppet to delete all the nagios_host and nagios_service resources that have been removed from the manifests.
Once Puppet has purged resources, we tell it to reload the nagios process using the exec resource type that is defined on lines 7 to 10.
The notify arrow notation (tilde + greater-than) on line 5 means that only if the nagios_host and/or nagios_service resources are purged, then the notify signal is sent to the exec resource. Note the refreshonly => true attribute on line 8. This attribute is specific to the exec resource, and it means that the resource will only be processed if the notify signal is received.
In other words, the reload-nagios exec resource will only run the /etc/init.d/nagios reload command, in case the nagios_host or nagios_service resources were purged.
Once you have created the nagios::purge class, save the file as nagios/manifests/purge.pp.
Purging resources with the nagios::purge class
We are now ready to try resource purging on the nagios server. Before we do this, let's add the nagios::purge class to the catalog of the nagios server.
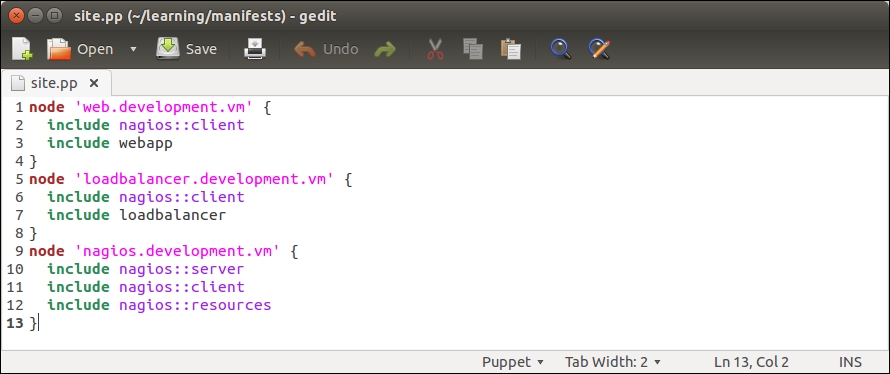
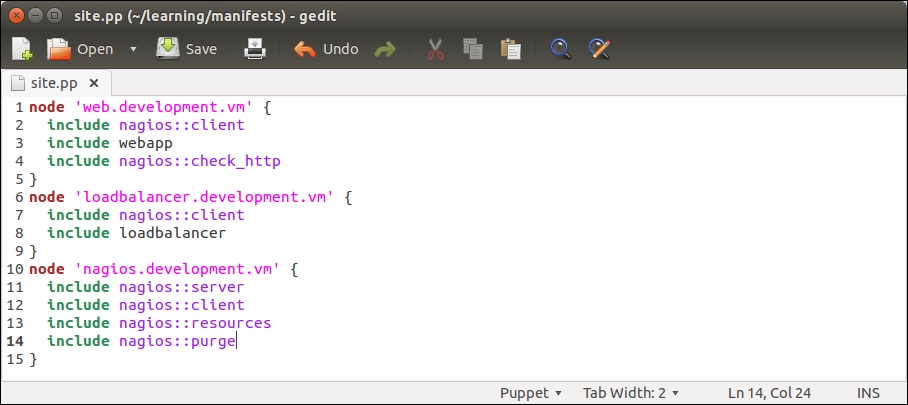
Open the node classification file, manifests/site.pp, and add an include nagios::purge statement to the nagios.development.vm node definition block, as shown on line 14 in the following screenshot:
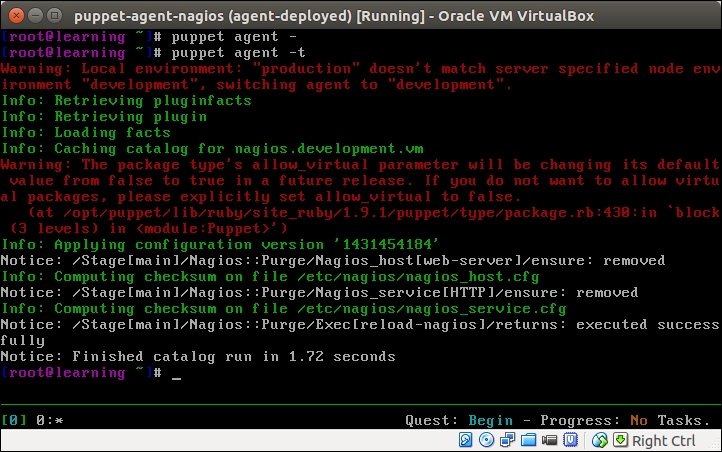
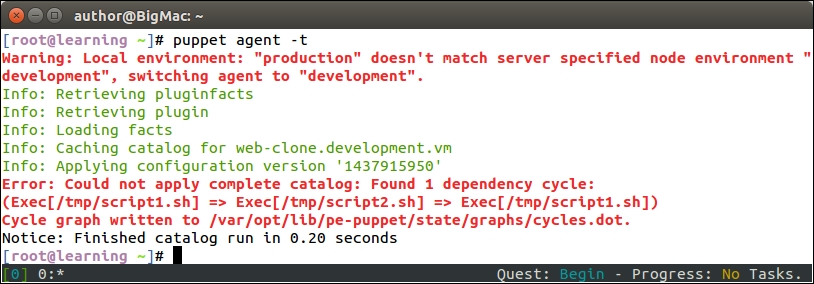
Once you've saved the file, go to the nagios server console and run the puppet agent -t command. The following output confirms that the nagios_host and nagios_service resources were removed successfully, and the nagios server process got reloaded:
Now go to the nagios web interface at http://192.168.56.12/nagios, and refresh the page by clicking on the Services link in the navigation pane on the left-hand side of the page. Did the web server nagios host disappear from the list?
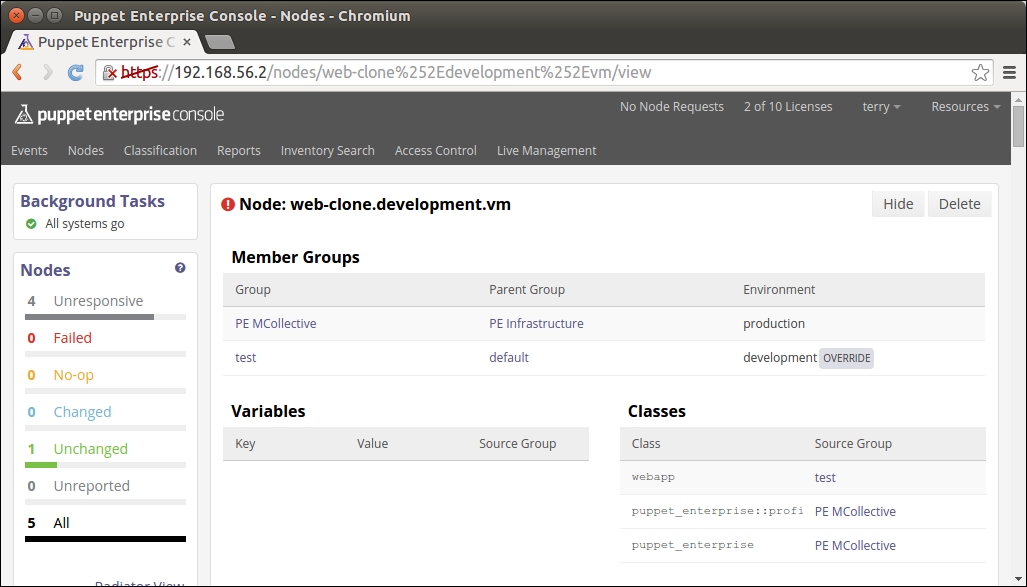
You should now have a fairly good understanding of how exported resources can be used to exchange Puppet resources between nodes. Next, we will take a look at how to query the node information from PuppetDB.
Where exported resources are used to exchange Puppet resources between nodes, the PuppetDB query is used to query information about the Puppet agent nodes.
For example, if we wish to find out the IP address that belongs to the nagios server node, we can make a query that asks for the value of the ipaddress_eth1 facter on the node that has the nagios::server class in its catalog.
Or if we want to know what certnames belong to Puppet agents in our environment, we can make a query that returns a list of certnames that belong to an environment called development.
There are a a couple of aspects to the PuppetDB query that some users may find a bit off-putting.
Firstly, the PuppetDB query syntax is quite complex, and the PuppetDB documentation available online (http://docs.puppetlabs.com/puppetdb/) signally fails to make it easier to learn. For example, to query the value of the ipaddress_eth1 fact of the nagios.development.vm node, we use the following command on the Puppet Master node:
Let's take a look at this command more in detail:
The command that we use is called curl. Curl is a handy utility that enables you to make HTTP requests from the command line.
The http://localhost:8080/v3/facts/ipaddress_eth1 URL we connect to is the PuppetDB API endpoint for querying facts.
In this instance, the fact we want to query is called ipaddress_eth1.
The --data-urlencode option encodes the query parameters and appends parameters to the URL.
The parameter we provided is certname=nagios.development.vm.
In English, this query can be described as "Please give me the value of fact ipaddress_eth1 that belongs to the Puppet agent that has the certname value nagios.development.vm".
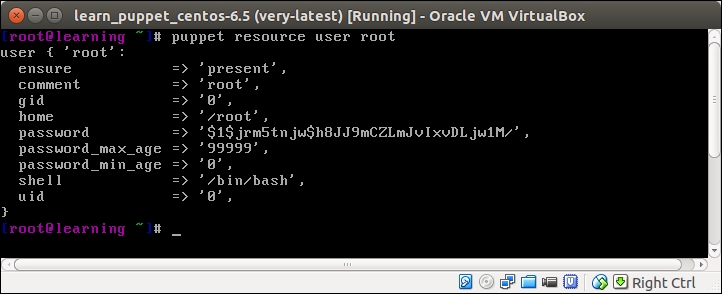
The query response is the following set of key-value pairs.
With this query, we learned that the node with certname nagios.development.vm has an ipaddress_eth1 facter with value 192.168.56.12. That's nice, but how can the query results be integrated with the Puppet deployment when the only documented interface is from the command line using Curl?
This brings us to the second issue with PuppetDB. There is no built-in interface to the PuppetDB query from the Puppet manifest, which is similar to what we have for exported resources, that uses the @@ notation to export resources and the <<||>> notation to import resources in the Puppet manifest.
Don't give up hope yet as there is a simple solution that provides a remedy for both of the previously mentioned issues. This is the Puppet community add-on module, which we will take a look at next.
Installing the dalen-puppetdbquery module
The Puppetdbquery module, created by Mr. Erik Dalén (documentation is available at https://github.com/dalen/puppet-puppetdbquery), is a handy tool that provides a simple command-line interface to PuppetDB as well as the functions to access PuppetDB from the manifests.
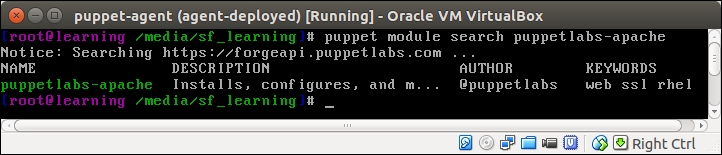
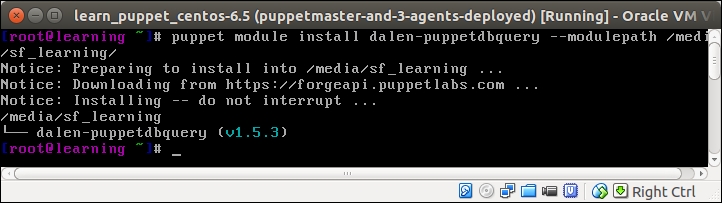
The Puppetdbquery module is available in Puppet Forge, and it can be installed with the following command:
The following screenshot shows the output of the preceding command:
Adding puppetdbquery into the RUBYLIB environment variable
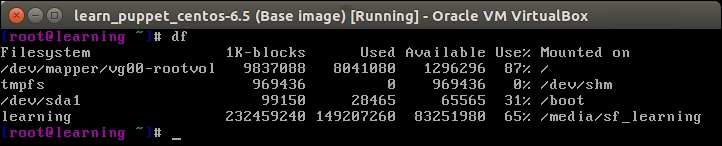
We have installed the dalen-puppetdbquery module in the /media/sf_learning/puppetdbquery directory. Before we can start experimenting with it, we need to add the module to the command-line environment on Puppet Master.
We can achieve this by adding the /media/sf_learning/puppetdbquery/lib path to the RUBYLIB environment variable using the following command:
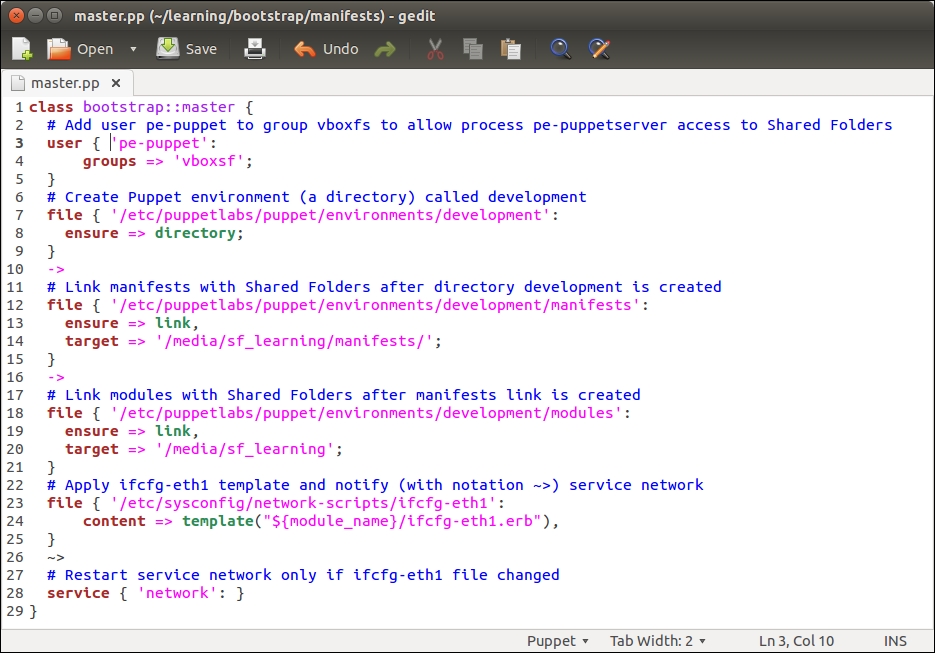
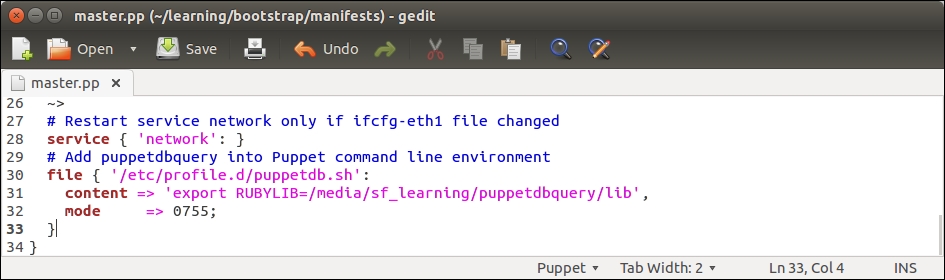
To make this change permanent, we don't have to manually run the command every time we log on to the Puppet Master. We can configure the bootstrap::master class to create an /etc/profile.d/puppetdb.sh file, which contains the preceding command.
Open the /media/sf_learning/bootstrap/manifests/master.pp file and add lines 30 to 33, as shown in the following screenshot:
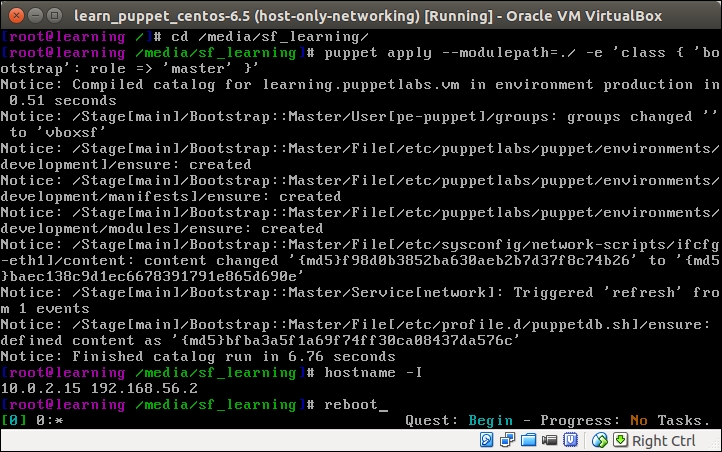
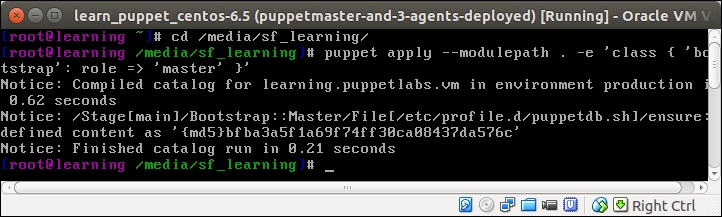
Once you have saved the file, reapply the bootstrap::master class on the Puppet Master node using the following two commands:
The puppet apply command produces the following report, confirming that the /etc/profile.d/puppetdb.sh file was created:
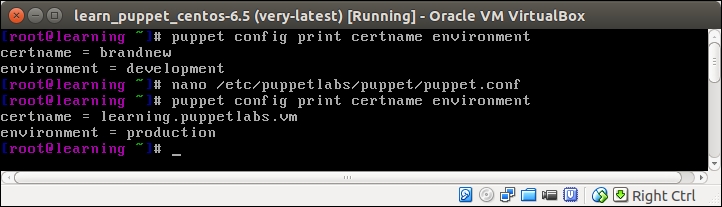
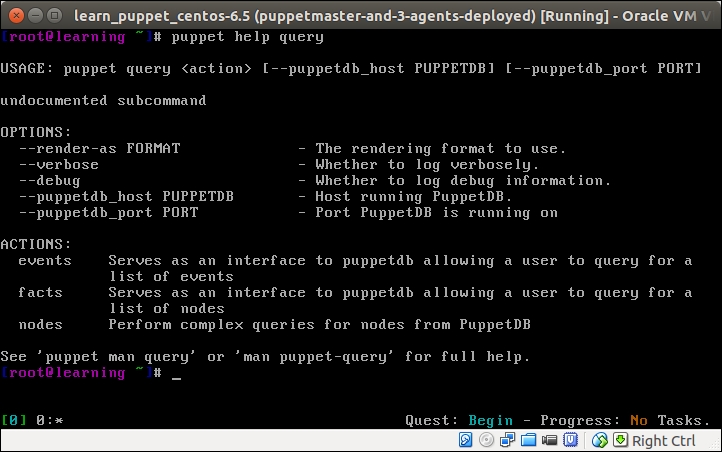
To make the change effective, you must log out and log in to the Puppet Master node. Once you are logged in again, you can verify that the puppetdbquery module is available by running the puppet help query command, which displays the help menu, as shown in the following screenshot:
Note
An alternative to logging out and logging in again is that you can run the source /etc/profile.d/puppetdb.sh command source to update the RUBYLIB environment variable.
Examples of Puppet query commands on the command line
Now we are ready to start experimenting with the puppet query command. As seen in the preceding screenshot, puppet query has three actions: events, facts, and nodes.
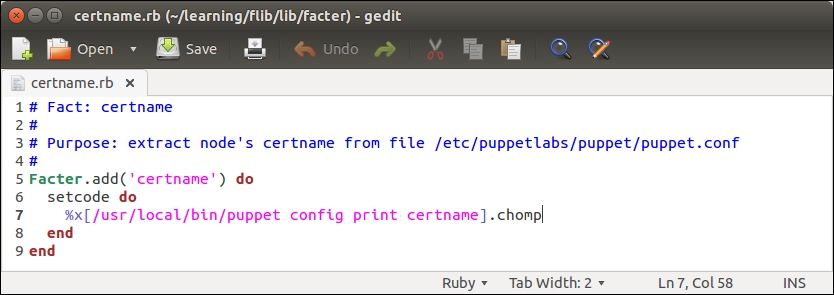
Querying certname with action nodes
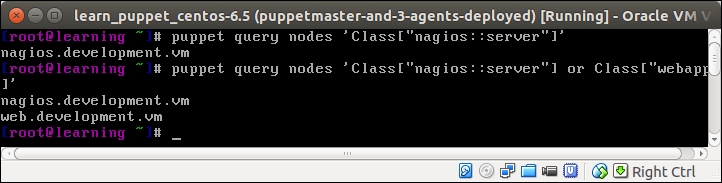
Let's first try the nodes action and make a PuppetDB query that returns the certname of the node that includes the nagios::server class in its catalog. We can do the query using the following command:
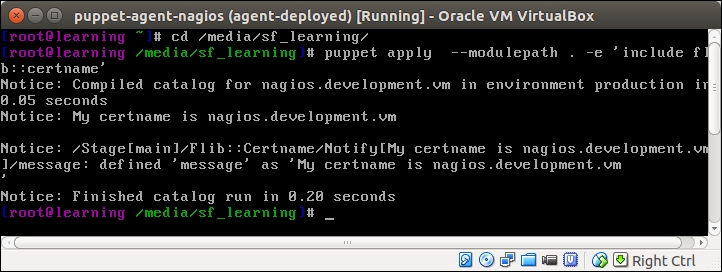
A query returns the string nagios.development.vm, which is the certname of the nagios server node.
To expand the scope of the query, we need to also include the certname of the node that has the webapp class in its catalog. We can do this using the or operator to join two search patterns:
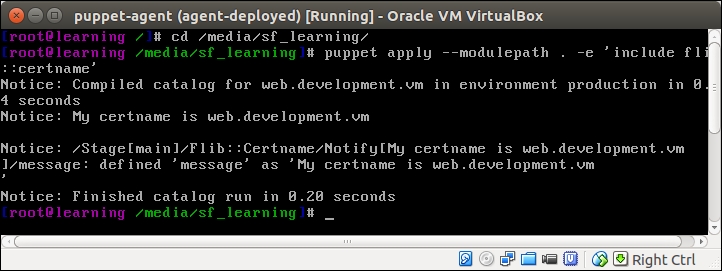
In addition to the string nagios.development.vm, the query returns a string web.development.vm, which is the certname of the web server node, as shown in the following screenshot:
Querying facts with action facts
Querying facts works in a similar fashion to querying nodes. The syntax for querying facts is the puppet query facts 'search pattern'. This will print out all the facts from the nodes that match the search pattern. To filter the query results so that the command only returns the selected facts instead of all the facts, we can use the --facts parameter to specify a list of facts that the command should return.
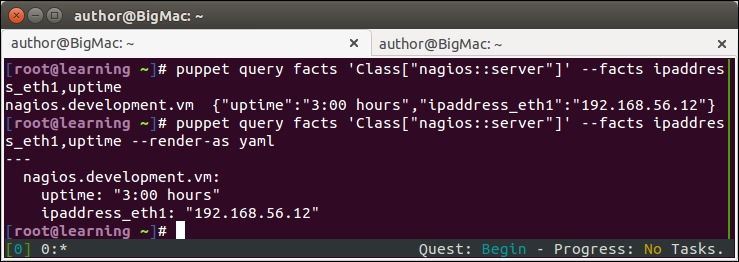
Here is a sample command on how to query the ipaddres_eth1 and uptime facts from the nagios server node:
This command will return the following hash of facts from the node:
To choose a different output format, we can add the –render-as yaml parameter to make the query return the yaml document instead of the standard PuppetDB query hash:
Here are the query results in the yaml document format:
Following is the screenshot of the preceding output:
Using the puppetdbquery functions
The Puppetdbquery module on the command line is a useful tool for testing query patterns and discovering information about nodes in PuppetDB. How can these queries be made part of the Puppet deployment?
The Puppetdbquery module comes with a couple of handy Puppet functions called query_nodes and query_facts that allow us to make the PuppetDB queries from the Puppet manifest. We can make use of these functions, for example, when configuring a load balancer node to balance the HTTP requests between the web server nodes. Instead of using static IP addresses for the load balancer configuration (like we currently do in the loadbalancer/manifests/create.pp file), we can use the query_nodes function to discover the IP addresses of all the web server nodes and configure the load balancer accordingly. Using this method, the load balancer configuration will automatically update if the web server node's IP address changes or if we add more web servers to the environment.
Before we dive into this, let's take a look at the syntax of the functions.
The
query_nodes function accepts two arguments:
A query pattern
A fact name (optional)
If only the query pattern is provided, the query returns a list of certnames that match the pattern. If the fact name is provided, the response is a list of fact values from the nodes that match the query pattern.
To give you a better idea of the syntax, we can convert one of the command-line queries, as we did earlier in the query_nodes function call:
When we call the function on the Puppet Master node, the query returns a list in the following format:
If we want the query_nodes function to return a list of facts instead of the certnames, we can specify the fact as the second argument in the query with the following syntax:
The query_nodes function returns a list of fact values:
This time, the query returns a list of IP addresses from the web server and nagios server nodes, [192.168.56.11, 192.168.56.12].
The
query_facts function returns a hash of hashes that contains facts from the nodes that match the query pattern.
To query the values of the ipaddress_eth1 and uptime facts from the nagios server node, which we already tried on the command line, using the query_facts function.
On the command line, type the following command:
Using the query_facts function in Puppet manifests, the syntax is slightly different:
This query returns a hash of hashes that contains the key-value pairs:
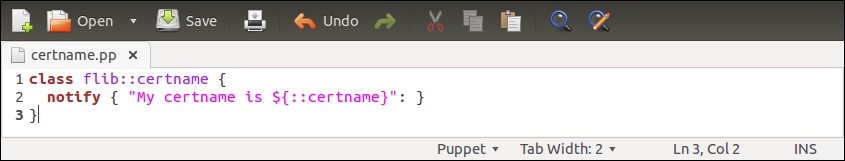
Creating a custom type for testing PuppetDB queries
Getting the PuppetDB query syntax right can often be tricky. When creating queries, it is important to test them properly to ensure that the queries return the desired results. To test PuppetDB queries, I usually create a short manifest that I run on the Puppet Master node, and examine the PuppetDB query results.
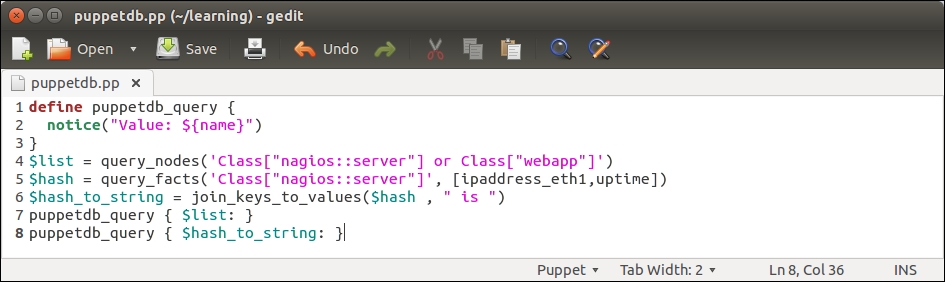
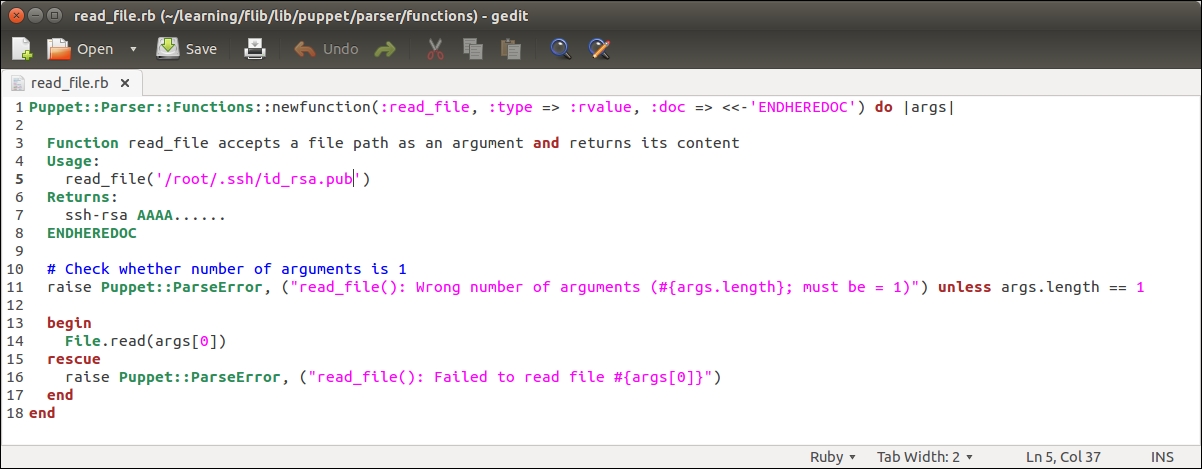
Create a new file in a text editor called puppetdb.pp with the following content:
The preceding manifest contains a custom defined type (lines 1-3), three variables (lines 4-6), and two references to a defined type (lines 7-8). Let's take a look at the manifest in detail:
Line 1 begins with a defined type called puppetdb_query.
This type is used for printing out PuppetDB query results.
Line 2 uses a Puppet function called notice (https://docs.puppetlabs.com/references/latest/function.html#notice) that outputs a string value joined with the value of the ${name} variable, which is set at the time when the type is called (lines 7-8).
Line 3 closes the custom defined type block.
Line 4 creates a variable called $list, where we store the PuppetDB query results from the query_nodes function.
The query_nodes function makes a PuppetDB query that returns a list of node names, such as a certname, that has the nagios::server or webapp class in its catalog.
Line 5 creates a $hash variable, where we store the results from the query_facts function.
The $hash variable name implies that the query_facts function returns a hash type of data (which means key-value pairs). The hash contains the values of facts ipaddress_eth1 and the uptime.
Line 6 defines the third and last variable that is used to store the hash content of the $hash variable in the format of a string, hence the name $hash_to_string.
The hash data type has to be converted to the string format so that we can use it when we call the type puppetdb_query (on line 8), which prints out the results of this query.
Line 7 calls the puppetdb_query defined type with the $list variable as the name of the resource.
Calling the defined type with a data type list as the name of the resource results in Puppet to call the type once per each element on the list.
Assuming that the query_nodes function (line 4) returns a list of two node names, the type puppetdb_query is called twice.
Line 8 makes another call to puppetdb_query, but this time using the $hash_to_string variable as the resource name.
In this case, puppetdb_query is only called once, and the whole content of the hash produced by the query_facts function (line 5) is printed on the screen.
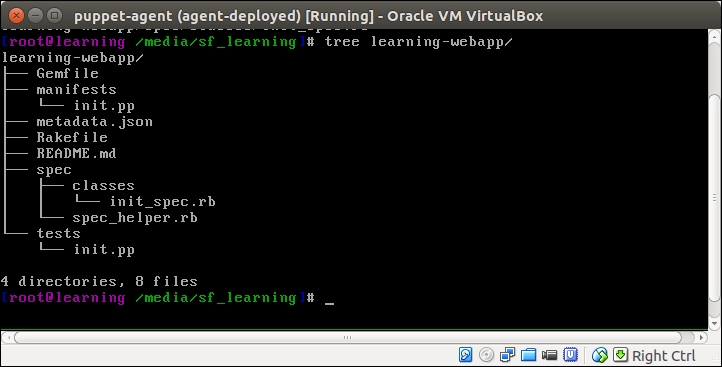
Once you have created the file, save it as puppetdb.pp under the Puppet module directory learning (on the virtual machine /media/sf_learning/puppetdb.pp).
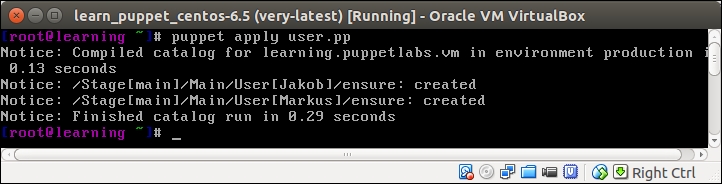
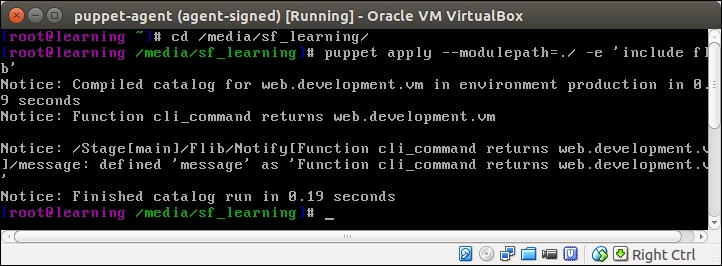
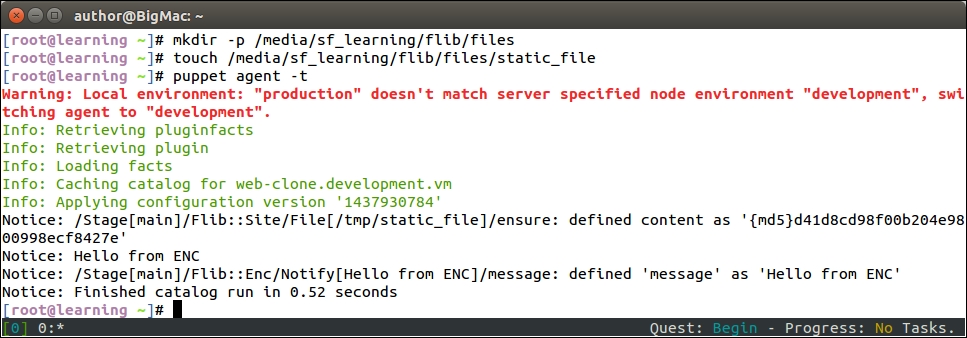
Then, we can try to apply the manifest to the Puppet Master node. Log on to the Puppet Master and run the following two commands:
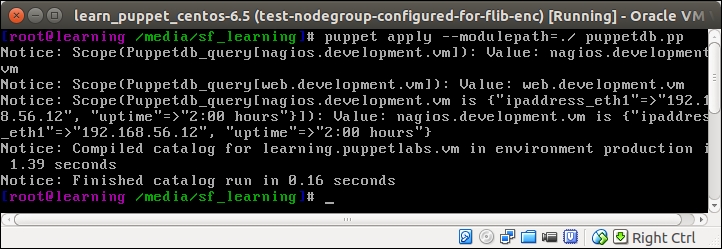
On a successful Puppet run, you should see the following events being reported.
The output from the Puppet run may look a little bit messy, but when we take a look at it more closely, we can identify the following three Puppet events:
nagios.development.vm: This is the first record returned from PuppetDB by the query_nodes function, and it matches the query pattern Class["nagios::server"] (line 4 in puppetdb.pp).
web.development.vm: This is the second record returned from PuppetDB by the query_nodes function, and it matches the query pattern Class["webapp"] (line 4 in puppetdb.pp).
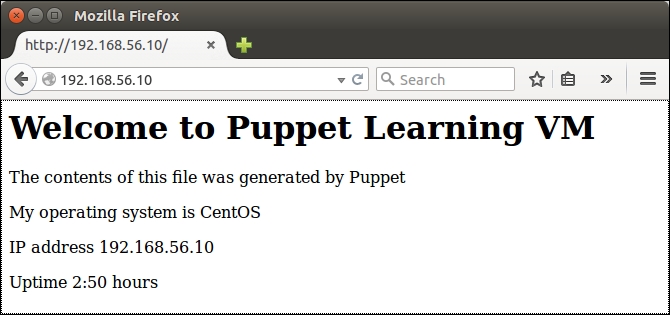
nagios.development.vm is {"uptime"=>"0:30 hours", "ipaddress_eth1"=>"192.168.56.12"}: This is the content of the hash returned from PuppetDB by the query_facts function (line 5 in puppetdb.pp).
Using the PuppetDB query to configure the load balancer
We now have a better understanding of how to interact with PuppetDB using the query_nodes and query_facts functions. Let's see how we can make use of these functions to configure the load balancer node.
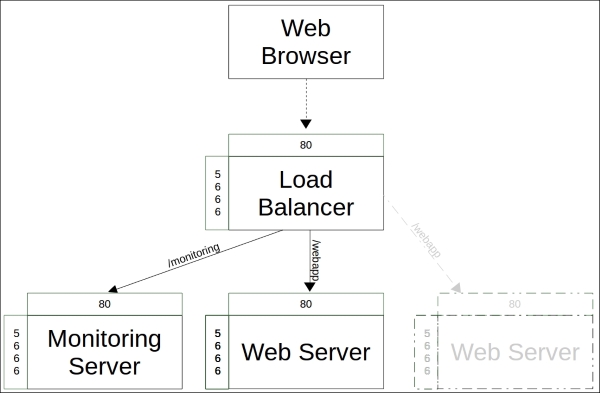
In Chapter 5, Load Balancing the Cluster, we created the loadbalancer and loadbalancer::create classes. The loadbalancer class created an HTTP proxy that routes the requests to the nagios server as well as to web server nodes via a load balancer that was created by the loadbalancer::create class.
One problem with these classes is that they are currently using the static IP configuration for the nagios server and web server connectivity. The loadbalancer class assumes that the nagios server has an IP address 192.168.56.11, and in the loadbalancer::create class, we assume that the web server nodes have the IP addresses 192.168.56.12 and 192.168.56.13.
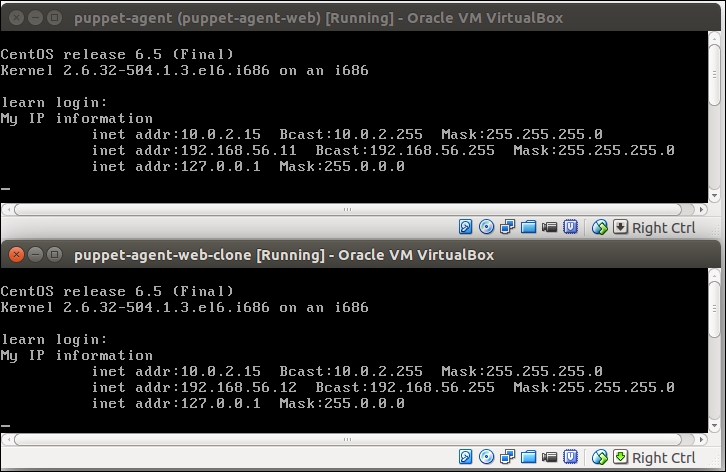
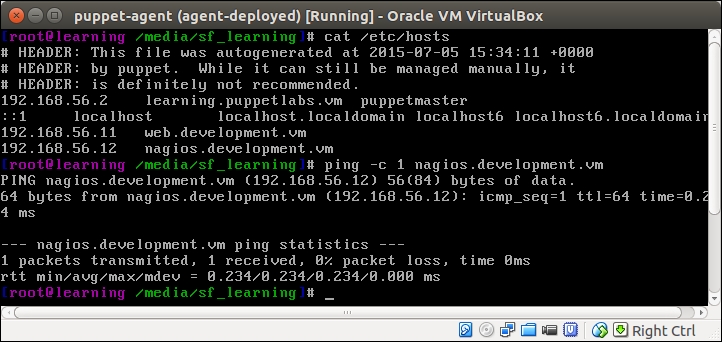
Since Chapter 5, Load Balancing the Cluster, I've been bouncing all the virtual machines a number of times, and VirtualBox has allocated different IP addresses to virtual machines. At this moment, my web server has an IP address 192.168.56.11, and the nagios server's IP address is 192.168.56.12. I guess in your environment, virtual machines have a different set of IP addresses.
Note
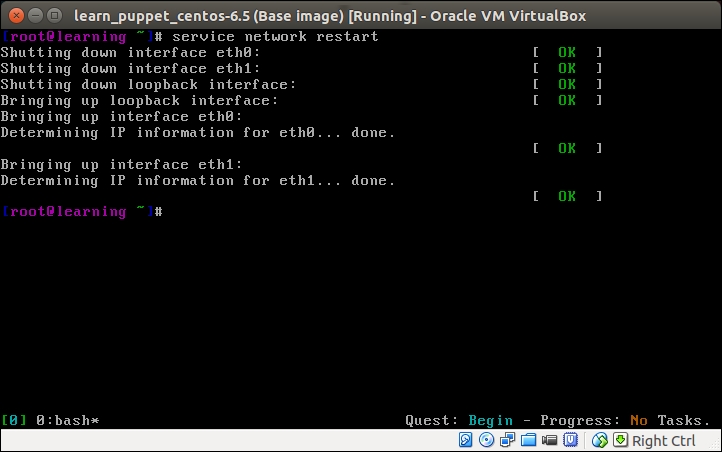
You can check the host's IP address with the hostname -I and ifconfig eth1 commands.
Unfortunately the virtual machine's IP addresses have changed, which means that the load balancer configuration in my environment is currently broken. The good news is that we can easily rectify the situation by making a couple of minor changes to the loadbalancer and loadbalancer::create classes.
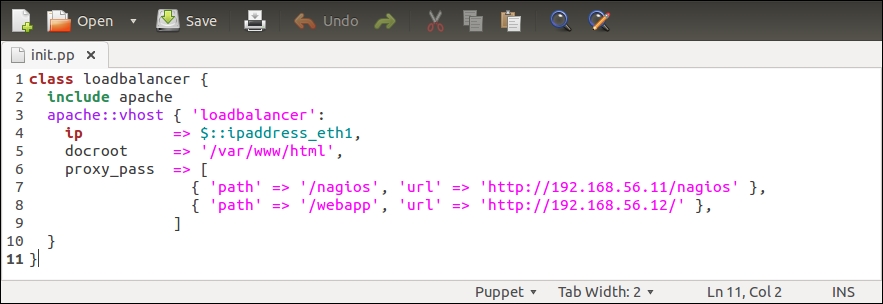
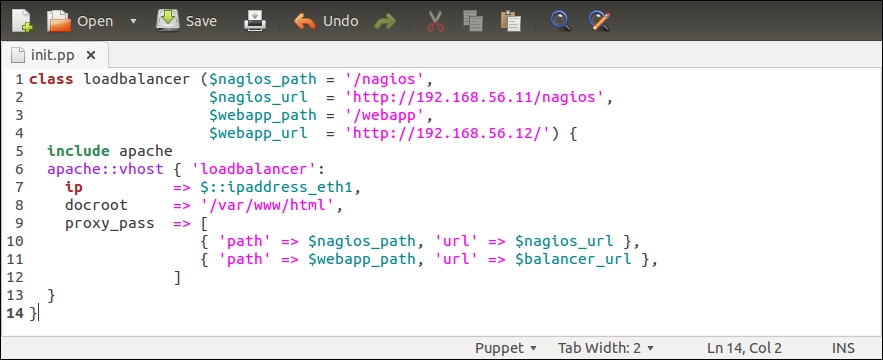
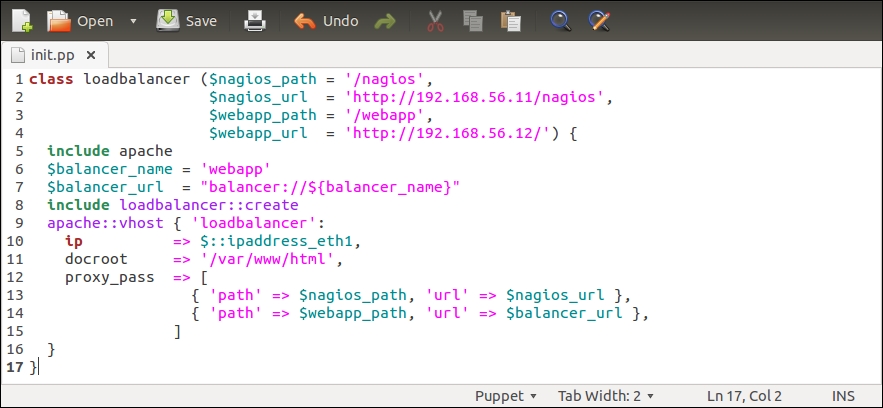
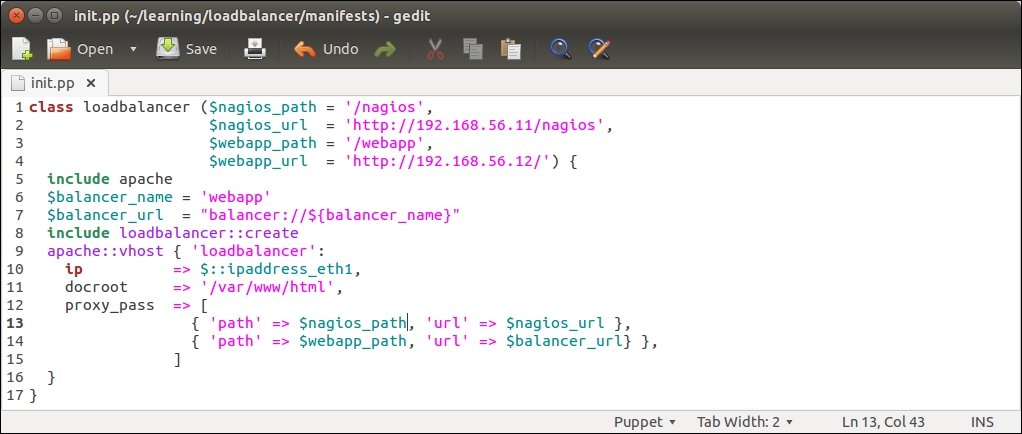
Let's first tackle the loadbalancer class, and add a couple of PuppetDB queries to it. Here is a screenshot of the loadbalancer class in its current state:
The $nagios_url variable on line 2 defines the nagios server address as http://192.168.56.11/nagios, and the variable is referenced on line 13 by the proxy_pass attribute.
Instead of using a predefined IP address in the $nagios_url variable, we can use the query_nodes function to extract the nagios server IP address from PuppetDB, and pass the IP address to the $nagios_url variable. We'll also add a similar PuppetDB query for web server nodes, which we can reference from the loadbalancer::create class.
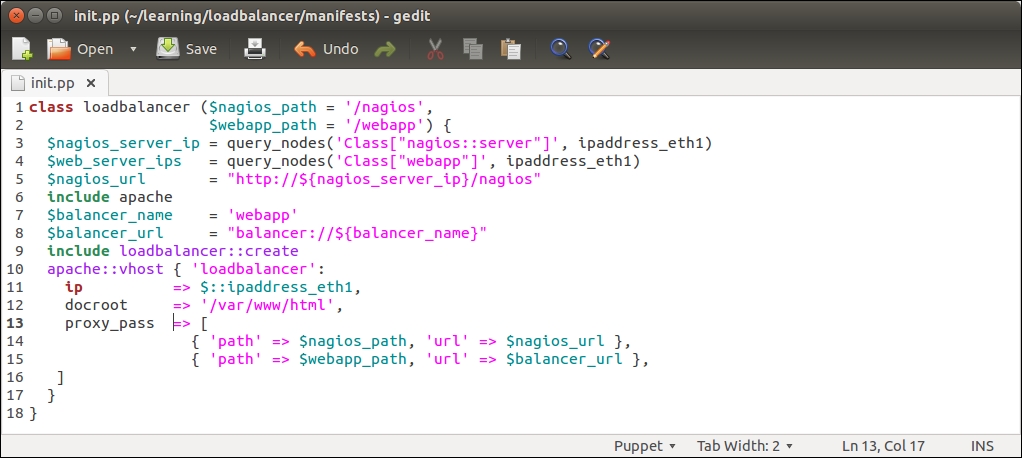
Here is a redesigned loadbalancer class that introduces you to two new PuppetDB queries and constructs the $nagios_url variable value from the query results:
Let's take a look at what has changed in the loadbalancer class:
Line 2 that was used to define the $nagios_url variable has been moved to line 5.
Line 4 was used to define the $webapp_url variable, but the variable is no longer needed, so this has been removed.
Line 3 creates a new variable called $nagios_server_ip. We store the nagios server's IP address in this variable. The IP address is queried from PuppetDB using the query_nodes function.
Line 4 creates a $web_server_ips variable. This variable stores a list of web server IP addresses, which are going to be referenced from the loadbalancer::create class.
Line 5 constructs the value for the $nagios_url variable based on the $nagios_server_ip variable (on line 3).
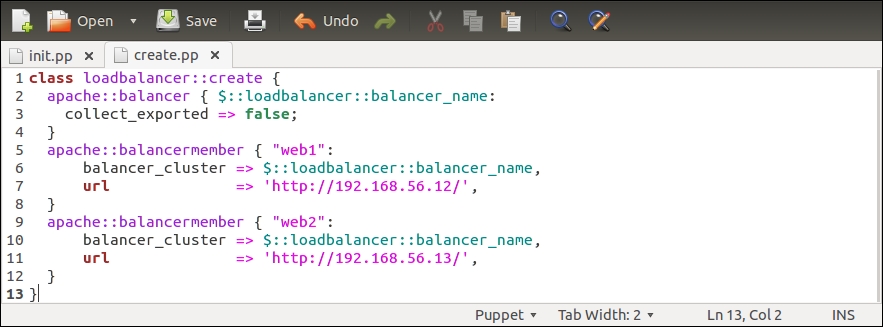
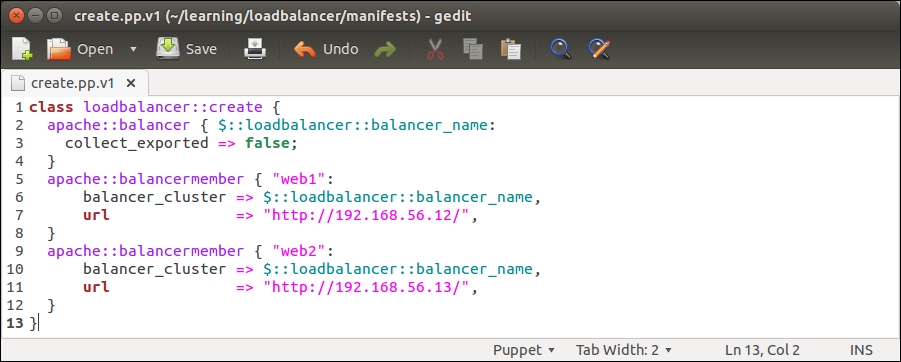
Before we try running this manifest on a load balancer, let's make a couple of changes to the loadbalancer::create class, which currently has the following content:
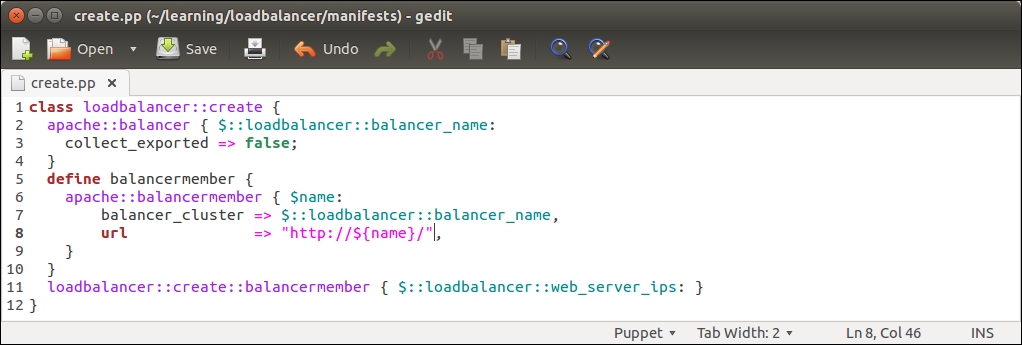
The loadbalancer::create class creates two apache::balancermember records, which we are going to substitute with a defined type that creates the apache::balancermember record for each web server IP address that the PuppetDB query returns (line 4 in the loadbalancer/manifests/init.pp file). Here is the screenshot of the newly designed loadbalancer::create class:
Let's take a look at what has changed in the loadbalancer::create class:
Lines 5 to 12 in the previous version of create.pp have been replaced by the defined type balancermember (lines 5 to 10). The balancermember type contains a reference to another defined type called apache::balancermember, which creates a new load balancing endpoint based on the ${name} variable. The endpoint URL is defined by the url attribute on line 8, which has a value http://${name}/. The ${name} variable is a reference to the name of the defined type, which is specified at the time when a type is called (on line 11). For example, if the type is referenced with a name 192.168.56.11, then the value of the url attribute will be http://192.168.56.11/.
Line 11 references the loadbalancer::create::balancermember defined type (on lines 5 to 10). Here, we use the $::loadbalancer::web_server_ips variable as the name of the type, which is a reference to the $web_server_ips variable that is defined in the loadbalancer class (line 4 in the loadbalancer/manifests/init.pp file). The $::loadbalancer::web_server_ips variable stores the results of the PuppetDB query query_nodes('Class["webapp"]', ipaddress_eth1). If the PuppetDB query returns a list of multiple IP addresses (this means that PuppetDB contains a record for more than one node matching the query pattern Class["webapp"]), the loadbalancer::create::balancermember defined type is called once per each entry in the list.
Once you are done with the changes made to the init.pp and create.pp files and have saved the files in the loadbalancer/manifests directory, we can move on to apply manifests on the load balancer node.
Testing the PuppetDB query manifests on the load balancer node
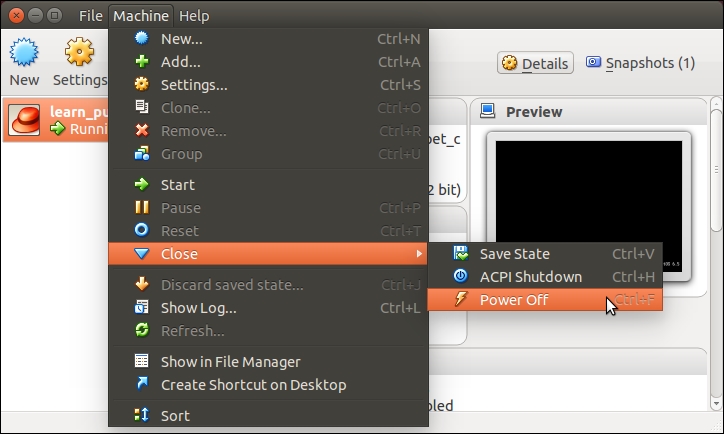
To test our manifest changes, you need to boot up the load balancer node and have Puppet Master running of course.
Once the load balancer node is running, log in with the username root and password puppet.
Then, execute the following two commands:
When the Puppet run completes successfully, you will see the following events displayed on the screen:
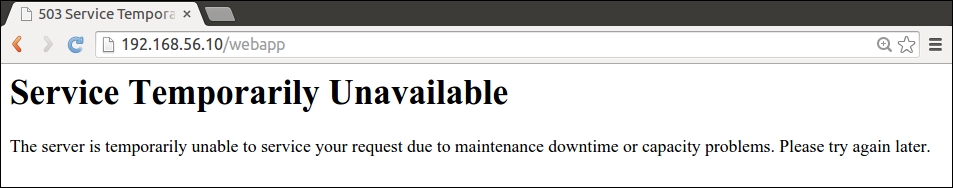
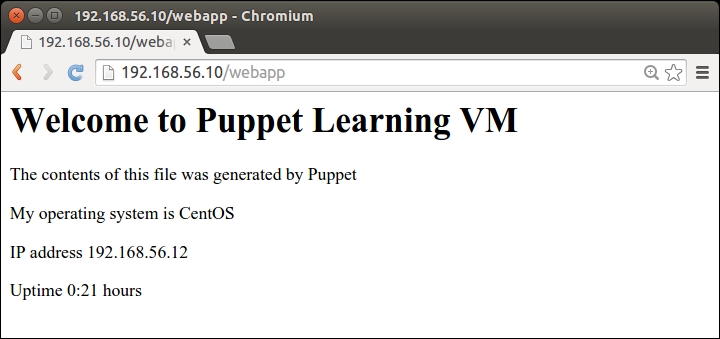
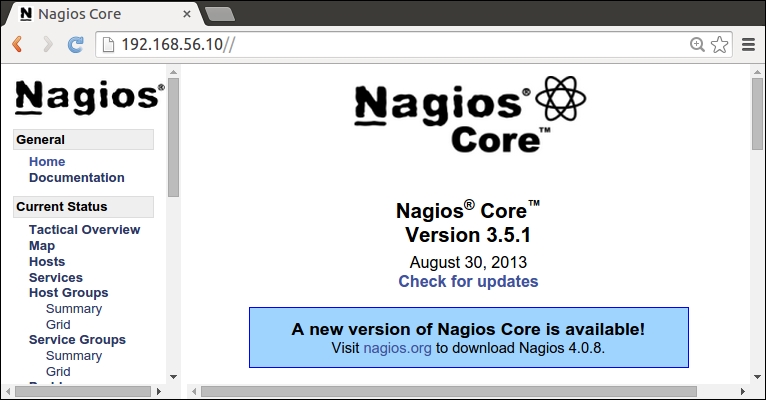
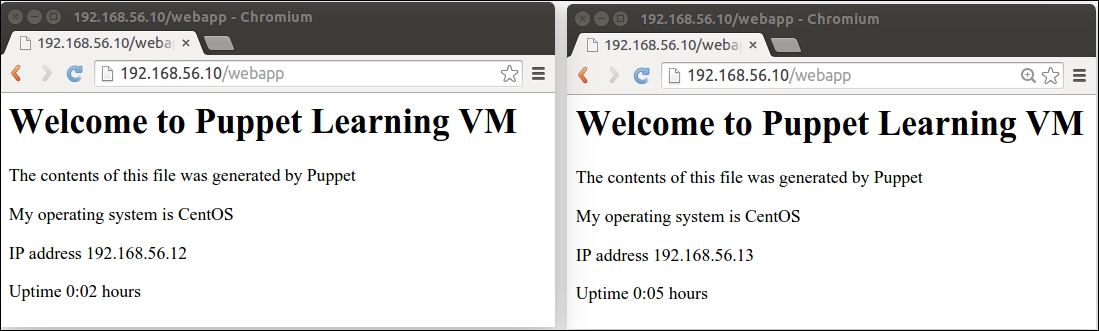
If you have the nagios server and web server nodes running, you should be able to access both of them via the load balancer node at http://<loadbalancer_ip>/nagios and http://<loadbalancer_ip>/webapp.
You can find out the value of <loadbalancer_ip > by running the hostname -I or ifconfig eth1 commands on the load balancer node.