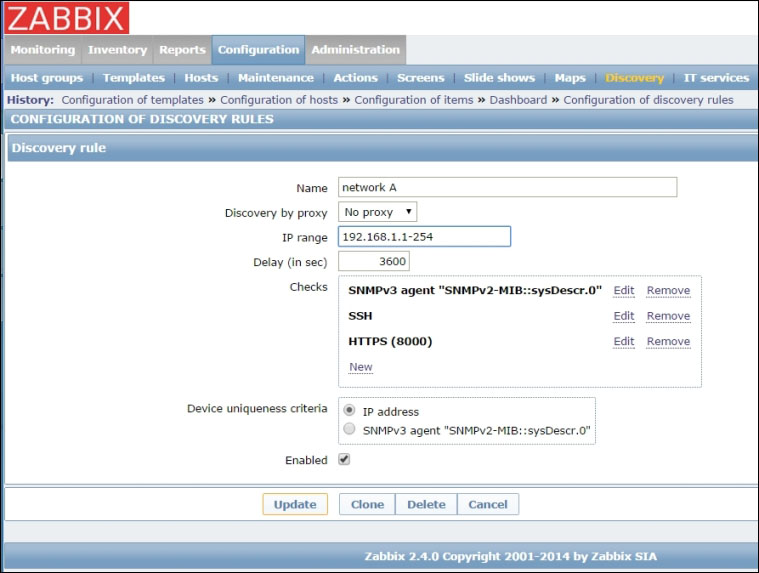
The three methods Zabbix can use to check for new or disappeared hosts, given an IP range, are:
Be aware that a discovery event will be generated if any one of these conditions is met. So, if a discovery rule has three checks defined and a host in the network responds to all three checks, three events will be generated, one per service.
As usual with all things Zabbix, a discovery rule will not do anything by itself, except generate a discovery event. It will then be the job of Zabbix's actions facility to detect the aforesaid event and decide whether and how to act on it.
Every action has a global scope: it's not tied to any particular trigger, host, or host group by default. This means that when you create an action, you'll need to provide some action conditions in order to make it valid only for certain events and not others. To access the discovery actions section in the web UI, head to Configuration | Actions and then select Discovery from the Event source drop-down menu, just under the Create action button.
When you create an action, you'll start with giving it a name and defining a default message in the action definition section. You'll then move to the action conditions section to provide filtering intelligence, before finishing with the action operations section to provide the action's core functionality. Action definitions are pretty simple as you'll just need to provide a unique name for the action and a default message, if you need one. So, let's move straight to the interesting sections of action configuration: conditions and operations.
Choosing action operations
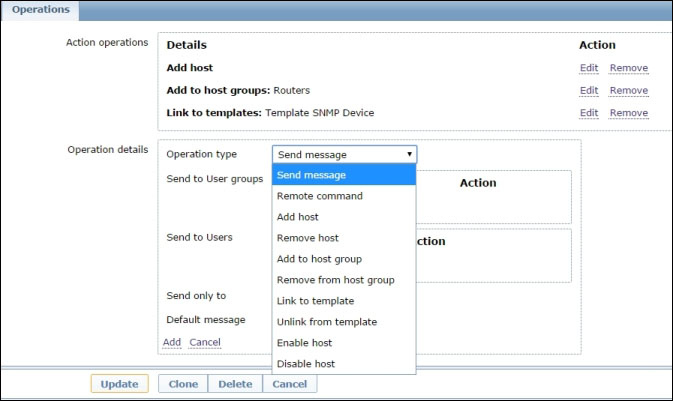
Discovery actions are somewhat simpler than trigger actions as there are no steps or escalations involved. This doesn't mean that you don't have quite a few options to choose from:
Please note that even if you defined a default message, it won't be sent until you specify the recipients in this section using the Send message operation. On the other hand, if adding (or removing) a host is a quite self-explanatory action, when it comes to adding to a host group or linking to a template, it becomes clear that a good set of actions with specific received value conditions and template-linking operations can give a high level of automation to your Zabbix installation.
Note
This high level of automation is probably more useful in rapidly changing environments that still display a good level of predictability, for example, the kind of hosts you can find, such as fast-growing grids or clusters. In these kinds of environments, you can have new hosts appearing on a daily basis, and maybe old hosts disappear at almost the same rate, but the kind of host is more or less always the same. This is the ideal premise for a small set of well-configured discovery rules and actions, so you don't have to constantly and manually add or remove the same types of hosts. On the other hand, if your environment is quite stable or you have a very high host type variability, you might want to look more closely at which, and how many hosts, you are monitoring as any error can be much more critical in such environments.
Also, limiting discovery actions to sending messages about discovered hosts can prove quite useful in such chaotic environments or where you don't control directly your systems' inventory and deployment. In such cases, getting simple alerts about new hosts, or disappearing ones, can help the monitoring team keep Zabbix updated despite any communication failure between IT departments, accidental or otherwise.
Moreover, you are not stuck with e-mails and SMSes for notifications or logging. In an Action operation form, you can only choose recipients as Zabbix users and groups. If the users don't have any media defined, or they don't have the right media for the action operation, they won't receive any message. Adding media to users is done through the Administration tab of the Zabbix frontend, where you can also specify a time window for a specific media to be used (so that you won't get discovery messages as an SMS in the middle of the night for example). Speaking of users and media types, you can also define custom ones, through the Media types section of the Administration tab in Zabbix's frontend. New media types will be available both in the Media section of the user configuration and as targets for message sending in the Action operations form.
An interesting use for new media types is to define custom scripts that can go beyond simple email or SMS sending.
A custom media script has to reside on the Zabbix server, in the directory indicated by the AlertScriptsPath variable, in the zabbix_server.conf configuration file. When called upon, it will be executed with three parameters passed by the server and taken from the action configuration in the context of the event that was generated:
$1: This is the recipient of the message
$2: This is the subject of the message
$3: This is the main message body
The recipient's address will be the one defined for the new media type in the corresponding media property for the user specified in the action operation step. The subject and the message body will also be passed according to the action operation step, as shown in the preceding list. This is all that Zabbix needs to know about the script.
The fact is, a custom script can actually do many different things with the message: logging to a local or remote directory, creating an XML document and interacting with a log manager web services API, printing on a custom display—just as with every custom solution, the sky's the limit with custom media types.
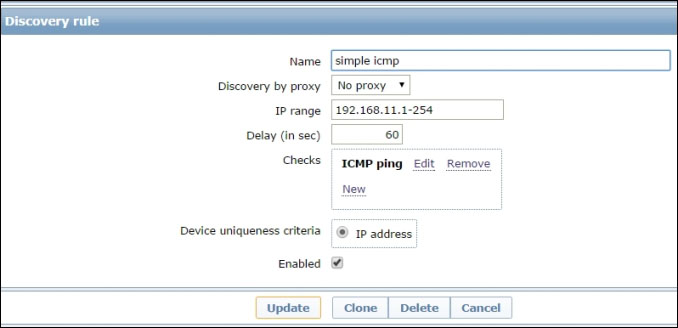
Here is a simple, practical example of such a custom media type. Let's say that your IT department has implemented a self-provisioning service for virtual machines so that developers and system admins can create their own VMs and use them for a limited amount of time before they are destroyed and the resources recycled. This laboratory of sorts has been put in a separate network, but users still have to gain access to it, and they are also administrators of those VMs, so there's very little control over what gets installed, configured, or uninstalled on those machines. In other words, while you could provision the VMs with a preinstalled Zabbix agent, you can't really rely on the fact that your users, whether inadvertently or for specific reasons, would not disable it, or would not install services that should really not be there, like a DHCP server for example. So, you decide to keep an eye on those machines directly from the Zabbix server (or a suitable proxy) and implement a simple discovery rule that will generate a discovery event for every host that responds to an ICMP echo request and nothing more, as follows:
Based on that rule, you'll want to configure an action that, for every host in that subnet, will perform a port scan and report the results via mail to you.
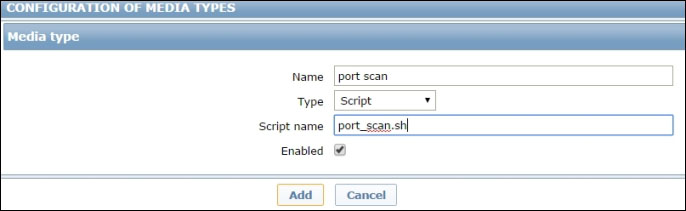
To do that, you'll first need to have a custom media type and the corresponding script. So, you head to Administration | Media types and click on Create media type. Once there, you assign a suitable name, select Script as a type and provide Zabbix with the name of the script to execute. Here, you just need to define the script name, as shown in the following screenshot. You'll find out later in the chapter in what directory the actual script should be placed:
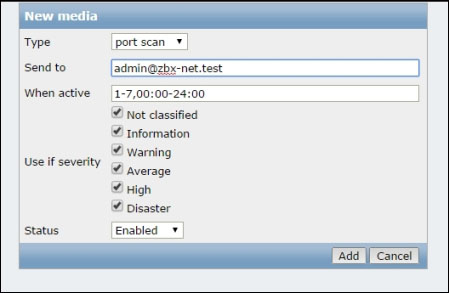
Just adding a media type is not enough though, you'll have to enable it for the user you intend to send those reports to. Just head to Administration | Users and select the user you want to add the new media type to. Quite predictably, the tab you want is called Media. Add the media you just created and remember to also add a way to tell the script where it should send the results. Since you are interested in receiving an e-mail address after all, that's what we'll tell Zabbix, as follows:
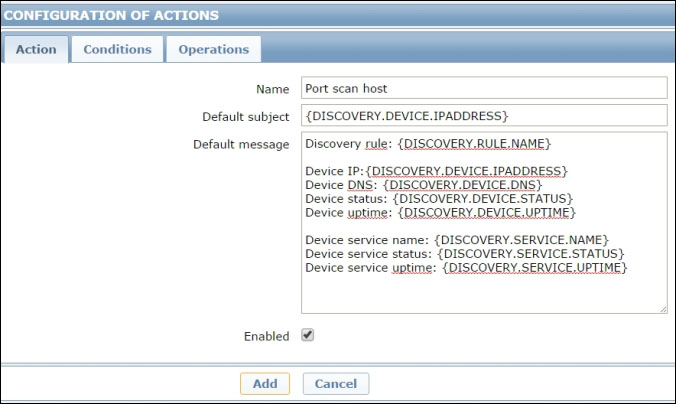
The Send to parameter will be the first argument passed to port_scan.sh, followed by the subject and the body of the message to send. So, before actually deploying the script, let's define the subject and the body of the message. To do that, you'll need to create an action for the discovery event, as follows:
For the purposes of the script, all you really need is the IP address of the host you are going to scan, but it certainly wouldn't hurt to add some more information in the final message.
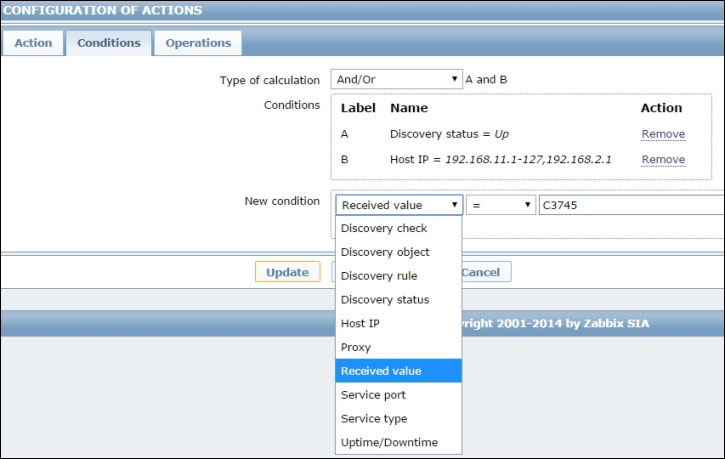
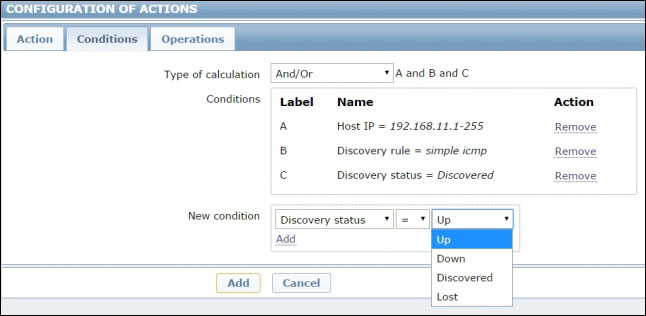
The next step is to define some conditions for the action. Remember that actions are global, so the first condition you want to set is the IP range on which this action will be performed, otherwise you'd run the risk of performing a port scan on every discovered host in your network.
You might also want to limit the action as a consequence for the discovery rule you created, independent of any other rules you might have on the same network.
Finally, you should make a decision about the discovery status. If you want a periodic update of what ports are open on a discovered host, you'll also need to define a condition for the host to be Up: in other words, for the host to be reported as live for at least two consecutive checks.
For as long as the host stays up, a port scan will be executed and reported according to the discovery interval of the rule you defined earlier. If you just want a port scan for a new host or for a host that has been reported as down for a while, you'll just need to fire the action on the condition that the host is Discovered; that is, it is now being reported up, while it was down before. What is certain is that you'll want to avoid any action if the host is down or unavailable.
The following screenshot encapsulates the discussion in this paragraph:
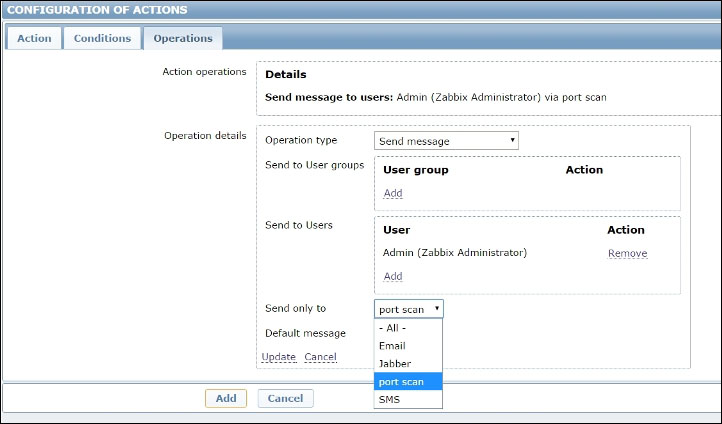
The last step is to define the action operation that is sending the message via the port_scan custom media type to the user you want, as follows:
Once done with this, you are finally ready to create the port_scan.sh script. So, head to the AlertScriptsPath directory as configured in your zabbix_server.conf (it's usually defined as /usr/lib/zabbix/alertscripts) and create the following script there:
Note
Don't forget to set the correct ownership and permissions for the script once you are done:
As you can see, the program that will perform the actual port scan is
Nmap, so make sure you have it installed. In case you don't have it installed, a simple yum install nmap will take care of that. The options passed to Nmap are just the basics: -sT performs a simple connect() scan. It's not the fanciest one, but it's the only one available to non-root users, and the script will be executed by Zabbix as the zabbix user. –A turns on traceroute, OS, and service detection so that the output is as complete as possible. Finally, -T5 forces Nmap to execute the port scan in as little time as possible. Once the script has the results of the port scan, it will just construct the message and send it to the recipient defined in the action.
This is, of course, a very basic script, but it will get the job done, and you'll soon receive a port scan report for every new VM created in your self-provisioning lab. To keep things simple and clear, we did not include any consistency checking or error reporting in case of problems, so that's certainly a way you can improve on this example. You could also try to send the results to a log file (or a log directory) instead of a mail address, or even to a database, so that other automation components can pick up the reports and make them available via other media such as web pages. What you'll probably want to avoid is to directly change the host's configuration, or Zabbix's own one, through this script.
Even if no one will prevent you from doing so, it's probably best if you avoid using all this power to execute complex scripts that might change your network configuration, such as enabling interfaces, adding rules to a firewall, and such like. While this is perfectly possible using a custom media script, this should be the domain of remote commands. These will take center stage in the next paragraph.
There are quite a few options available to you when it comes to executing remote commands as an action operation.
You can define a list of IPMI commands to be run on the target host or a series of SSH commands that connect to a box and perform various operations there. A remote command could even be a simple wrapper for a remote script deployed on a Zabbix agent, or a custom script that will be run either on an agent or on the Zabbix server itself.
The truth is, sometimes, remote commands can be just a little too powerful. You can start and stop services, deploy or provision software, make configuration changes, open or close firewall ports, and everything else you can possibly imagine, as long as you can write a script for it. While this can sound fascinating and promising, we have found over the years that these solutions tend to be fragile and unpredictable. One of the reasons is that Zabbix doesn't warn you if a remote command fails. More importantly, environments tend to change faster than these automation tools so that you can quickly find yourself dealing with the unintended consequences of a remote command running where it should not run, or not running when it should run.
The more of these you add, the more it will be hard to keep track of them, and the more one can be lured into a false sense of security, counting on the fact that remote commands are taking care of things, while, in fact, they may be contributing to the chaos instead of taming it.
That said, it's certainly undeniable that remote commands can be useful. Let's see an example that is both helpful for your Zabbix configuration and also fairly safe.
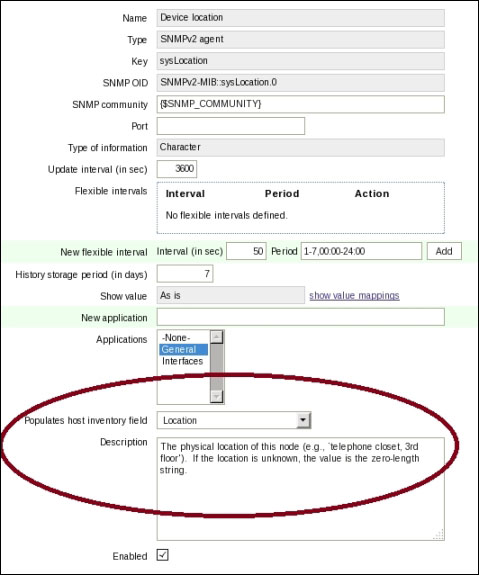
In Chapter 2, Active Monitoring of Your Devices, we've seen how it's possible to use some of the measurements, as reported by a host's items, to populate the same host's inventory fields. This is a great solution for the fields that can be filled this way, but what about the other ones? Things like POC details, maintenance dates, installer name, installed software, and such like can't always be extrapolated from monitoring metrics as they may simply not be available on the monitored host itself.
They usually are available, though, on asset inventory systems that IT departments use to keep track of available resources.
In the following example, you'll create an action operation that will execute a remote command on the Zabbix server, fetch some inventory information from an asset database, and fill up or update the host's inventory details.
Before proceeding with the command, let's make an assumption and some preparations.
There are many asset inventory systems available, some proprietary and some open source. All of them have different database schemas and different ways to expose their data. Moreover, an inventory database structure depends as much on the actual environment it's put into, and the processes that govern the aforesaid environment, as it is on its internal specifications. So, we decided to use a dummy asset management tool that will return, given an IP address, a simple JSON object containing all the inventory data you need for the task at hand. The assumption is that you'll be able to put the example into your context and figure out how to extract the same information from your own inventory management system, and that you will also know what authentication scheme you will rely on if you need to make just one request or multiple related requests, and so on.
Secondly, for practical reasons we are going to use Python as the language of the command script, so you'll want to make sure that it's installed and available on your Zabbix server. If it's not there, you can install it, and the related utilities, quite easily using yum:
Finally, we are going to interact with Zabbix's configuration not through direct queries to its database, but through its API. In order to do that, we'll use a very useful Python library, called
pyzabbix. You can find it at https://github.com/lukecyca/pyzabbix, but since you installed pip, it will be extremely easy to make it available to your Python installation. Just run the following command:
The Python package manager will download and install it for you.
Now we are ready to configure the discovery action and write the actual command script.
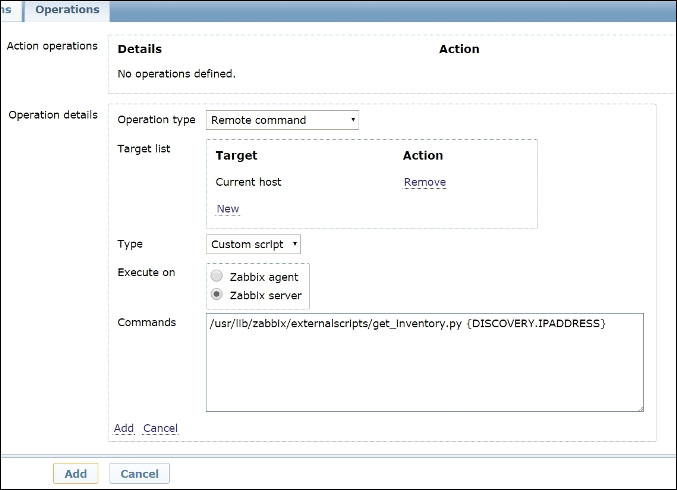
You can choose to reuse an existing discovery rule, such as the simple ICMP rule you used in the previous paragraph, you can create a new one specific to a single network to scan, a single TCP port that has to be available, or the presence of a Zabbix agent. We won't go into any more details here, as you've already learned how to configure one earlier in the chapter. Similarly, we can safely skip any detail about the action conditions as they might also be entirely similar to those shown earlier. What changes is, of course, the action operation. The following screenshot will give you a better idea of what we have been talking about in this paragraph:
The important elements here are the fact that the script should be executed on the Zabbix server, the fact that we specified the full path for the script, and the fact that we are using the {DISCOVERY.IPADDRESS} macro as the argument.
Once the action is configured, you are ready to prepare the actual script. Let's see how it would look:
As you can see, the script is fairly straightforward and simplistic, but it can be used as a starting point for your own inventory-updating scripts. The main thing that you need to take care of is to figure out how to get your inventory data from your asset database. You might need to connect to a REST API, or get an XML document via a web service, or even perform some queries via ODBC. What matters is that you end up with a Python dictionary or list containing all that you need to update the relevant host in Zabbix.
The second part of the script first of all shows you how to connect to the Zabbix API using the ZabbixAPI constructor. It then proceeds with the login method, where you'll need to provide the credentials you configured earlier.
All get methods accept a filter parameter that you can use to retrieve a single object or a list of objects that satisfy certain conditions. In this case, we used it to get the hostid of the host that is associated with a specific IP address.
Pay attention to the next line as the value returned by all get methods is always a list, even if it contains only one element. That's why we need to reference the first element of hostinfo, element 0, before referencing the inventory dictionary key.
We only showed three inventory fields here, but there are many more available in Zabbix, so it may be a good idea to build a dictionary with all Zabbix inventory fields as keys and the retrieved values as values.
Now that we have the hostid and the inventory information at our disposal, we can proceed with the actual inventory update. The update method is fairly straightforward: you specify the hostid of the host you want to update and the new values for the fields that you need to update.
And that's it, with a script like this configured as a remote command for a discovery action, you can keep your Zabbix inventory data in sync with whatever asset management system you may have.
As you might have realized, host discovery can be quite a complex matter because of the sheer number of variables you need to take care of, and because it's not always easy, in a real-world network, to identify a clear logic for host creation, template assignment, and other monitoring parameters, based on discovery data.
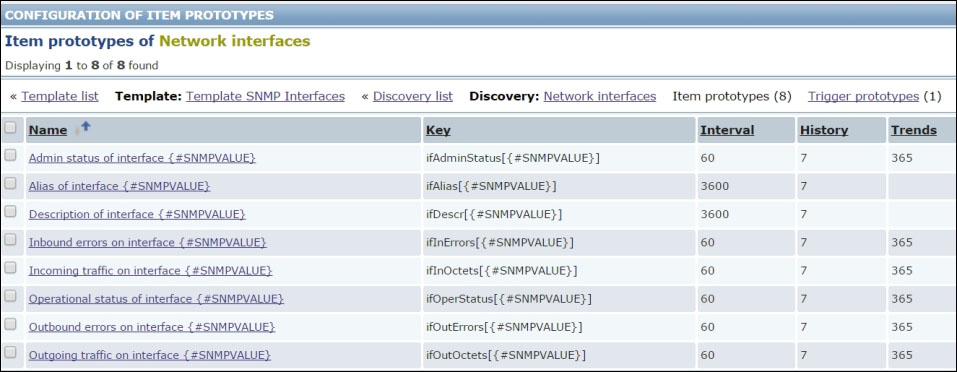
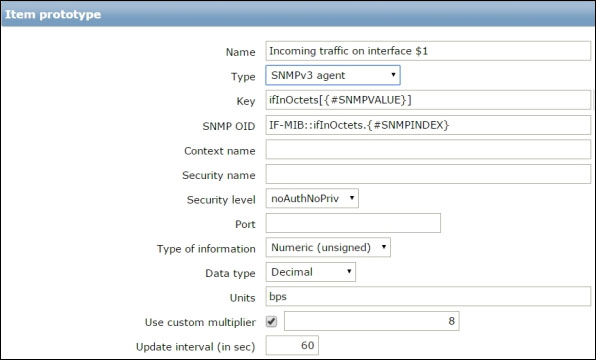
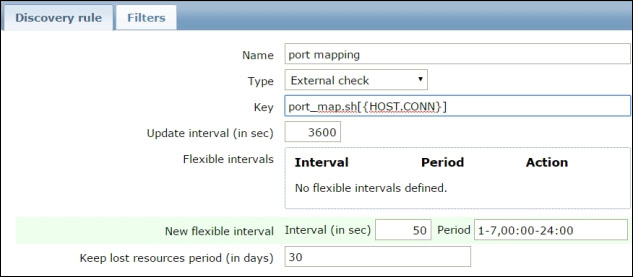
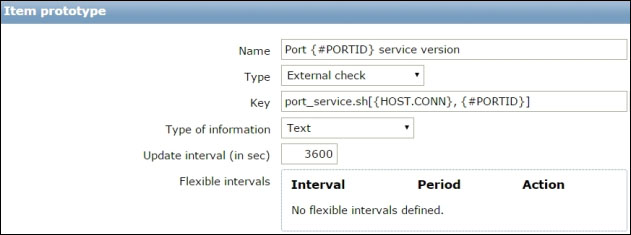
Low-level discovery, by contrast, is much more simple, given its power to dynamically create specific items as a host's available resources are discovered. So, let's use the remaining pages of this chapter to explore a few aspects of this extremely useful feature.