There are two supported ways to debug Ruby code with puppetserver—ruby-debug and Pry. Both of these will implement a Read Eval Print Loop (REPL). A REPL allows you to type commands and have them evaluated in real time. When working with puppetserver, this gives you the power to inspect the puppetserver process while it is compiling a catalog or processing a report. Both ruby-debug and Pry are installed as Ruby gems. To use them with puppetserver, you have to install them by using the puppetserver gem command. I prefer to use Pry. So, I will show you how to use Pry in this example. We'll inspect calls to the hiera function by using Pry. To start, install Pry for use within puppetserver, as follows:
With Pry installed, we can modify the hiera function to include a binding to Pry within the definition of Hiera. This definition will be in the hiera.rb file within the puppet/parser/functions directory. On my test system, this is /usr/lib/ruby/site_ruby/1.8/puppet/parser/functions/hiera.rb. Modify the definition of Hiera within this file by adding the require 'pry' line, as follows:
Next, stop the puppetserver process and start it up again in the foreground. Puppet Server conveniently includes a foreground mode to facilitate this:
Wait for the server to start. The puppetserver process will be ready to accept connections from agents once a message that is similar to the following is printed:
With our Pry binding in place, we need to have a call to hiera in our catalog. Put the following in your site.pp file:
With this in place, start an agent run against puppetserver. This will start compiling the catalog until the compilation hits the call to hiera. At which point, puppetserver will print the following:
This is the Pry REPL shell. You can now type commands in this shell and have your commands evaluated in real time. In this instance, we can inspect the value of key, the key that is being looked up, as follows:
As expected, the value of key is trouble. The interesting thing is that we can alter the return value for the hiera call at this point by entering our own value, as follows:
Back on the trouble node, we can see that the value that we entered previously is the value of notify:
The ability to modify and inspect code while a catalog is compiling is very powerful. A word of caution here; to make the node apply the catalog successfully, you will need to exit the REPL shell before the node gives up and returns an execution expired error.
Debugging the core Puppet functions is a less common use of Pry. In practice, you would be debugging your own defined functions. If your custom function is synced with pluginsync, you can update the definition to include Pry when you send a special argument to your own custom function. As an example, consider a situation where the example function, trouble, has two arguments—a string and a debug flag, as shown in the following code:
Create a module (trouble) and place the preceding code in a trouble.rb file within the puppet/parser/functions directory. Then, include a call to your new trouble function in your site manifest, as shown in the following code:
Now, start a Puppet agent run. Note that the nothing here string is the output on the master:
Append a second argument to the preceding trouble function call, as follows:
Now, when you start the agent again, you will be placed in a Pry shell. You can override the return value of the function as well:
Running puppetserver in the foreground allows us to interact and interfere with the server in a way that was significantly more difficult to achieve with the Passenger implementation.
Puppet Server is configured from the /etc/puppetserver directory. The TrapperKeeper configuration file is bootstrap.cfg. Each line of this file contains the configuration of a service to start.
Puppet Server logging is handled by Logback. Logback is configured in the logback.xml file. The default level is INFO. This level can be increased to DEBUG by changing the line, as follows:
After changing these settings, puppetserver will need to be restarted. The default location for the puppetserver log is /var/log/puppetserver/puppetserver.log.
Both Puppet Server and PuppetDB use Logback for their logging configuration. As more Puppet applications are moved to the TrapperKeeper framework, they too will use Logback for logging.
Logging in the previous versions of Puppet, or when run without puppetserver, is configured in the puppet.conf configuration file. The configuration options for logging are the logdir, masterlog, and log_level options. The log_level option specifies which messages are written to the log. The available levels are debug, info, notice, warning, err, alert, emerg, crit, and verbose. After changing the value, you will need to restart the master, or the web server if you are running through Passenger.
When things go wrong, you rely on reports to keep you informed. After the agent completes the catalog application, if the agent is configured to send reports, it will assemble all the log messages that were generated during the catalog run as well as some metric information and compile this into a YAML object. The YAML object is returned to the master. By default, the master will dump the reports into files without any further processing, this is the store report type.
If the master is configured to run any other report processors (by setting multiple values for the reports setting in puppet.conf), then they will run in the specified order. The agent connection will remain open during this processing time and potentially return an error to the client. If the report processor does not complete within the timeout setting, then an execution expired error will be returned. The timeout can be tuned with the help of the configtimeout option in the [agent] section of puppet.conf.
This setting has been deprecated in favor of the http_connect_timeout and http_read_timeout settings. In Puppet 4, the http_read_timeout setting is unlimited. The types of timeouts that were previously seen should no longer occur.
Report processors are stored in the plugin report directory and are written in Ruby. The simplest report processor is the store.rb store processor. This simply stores the incoming YAML in a file. If you are writing your own processor, then this is the place to start. You can take the store report and modify it to suit your needs.
You can specify more than one processor in the reports setting. The processors are run in the specified order. If one of your processors is failing, to ensure that nothing is wrong with your configuration, place the store processor first in the list of reports and ensure that a report is being created in the reports directory on the master. Other report processors are available for having Puppet send reports to an IRC server or HipChat. Some of these processors are listed at https://docs.puppetlabs.com/guides/reporting.html.
PuppetDB can also be used to store reports. You will need to enable the PuppetDB report type to store reports in PuppetDB. One important thing to remember with reports is that they take up a lot of space and build up quickly. If you are using the store report type, then you need to arrange to remove the stale reports on a regular basis. A good thing about using PuppetDB is that the stale reports are removed automatically, by default, only 14 days of reports are retained.
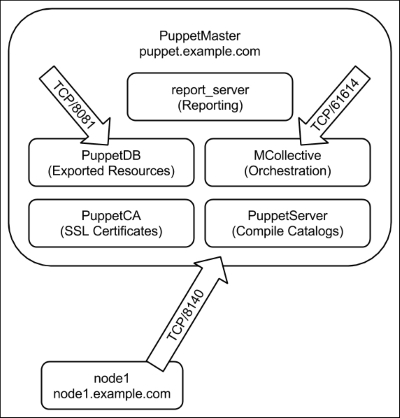
In a large deployment, you may have a report only master configured. This is specified with the report_server directive in the [agent] section of puppet.conf on your agent nodes. For this type of configuration to work, your report master has to trust the certificate of the agent. The report master should use the same SSL certificate authority as your other Puppet master servers use.
If you are using a separate report_master, then you need to be concerned about time. This is the same concern as when you have your certificate authority separate from your masters. The time must be synchronized to ensure that the certificate is valid. The validity period of a certificate is set when it is signed. The validity starts when the certificate is signed and by default, the period is 5 years. To view the validity, use the x509 utility of OpenSSL, as shown in the following command:
Time drift is a problem for many systems. Your systems should all synchronize their time to a central time source. If your systems drift (move away from true time) together, then it won't be a problem for certificates, only when you access external systems will this be a problem. When debugging, it is important to realize that the time of validity is contained within the certificate. If you have a multi-master configuration with your certificate authority is on a different machine, then you may run into a situation where nodes request certificates are signed by the CA but are not yet valid according to the time on your compile masters. The same situation happens when the time on your report master is behind that of the CA. This can be particularly confusing, as your node will apply the catalog but then fail to upload the report and return an error code for the Puppet agent run.
Time synchronization is important with SSL-protected services. When there are time synchronization issues, you will see errors such as the following:
When you connect to an SSL service using curl when there is a time synchronization issue, you will see the following type of error message:
When using curl to debug this type of problem, you can add the verbose option to get more details. In this instance, we can see that the certificate has expired, as shown by the following error message: