We briefly touched on what PuppetDB was in Chapter 1, Puppet as a Security Tool. It is a backend database engine that stores information on your Puppet environment.
We can query this information directly to see the current status of a host, get information on its current resources, and more. Additionally, it contains a complete set of reports if configured to do so.
PuppetDB contains a very rich API allowing us to use RESTful API calls via HTTP to retrieve information.
Note
REST, which is shorthand for Representational State Transfer, is a method of laying out an API using representations of a given resource. In this case, the resources will be information about Puppet. It makes querying and modifying information using HTTP fairly straightforward.
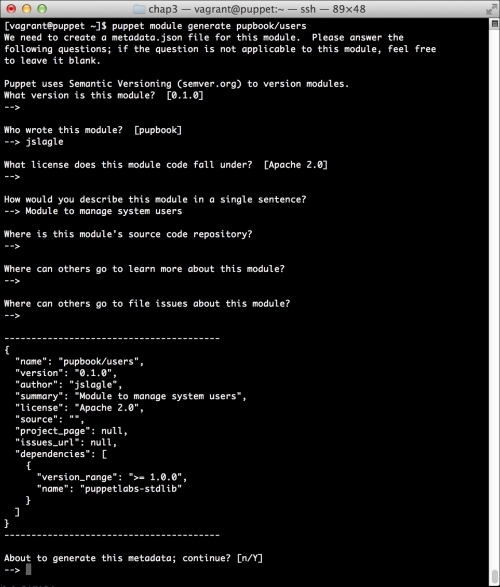
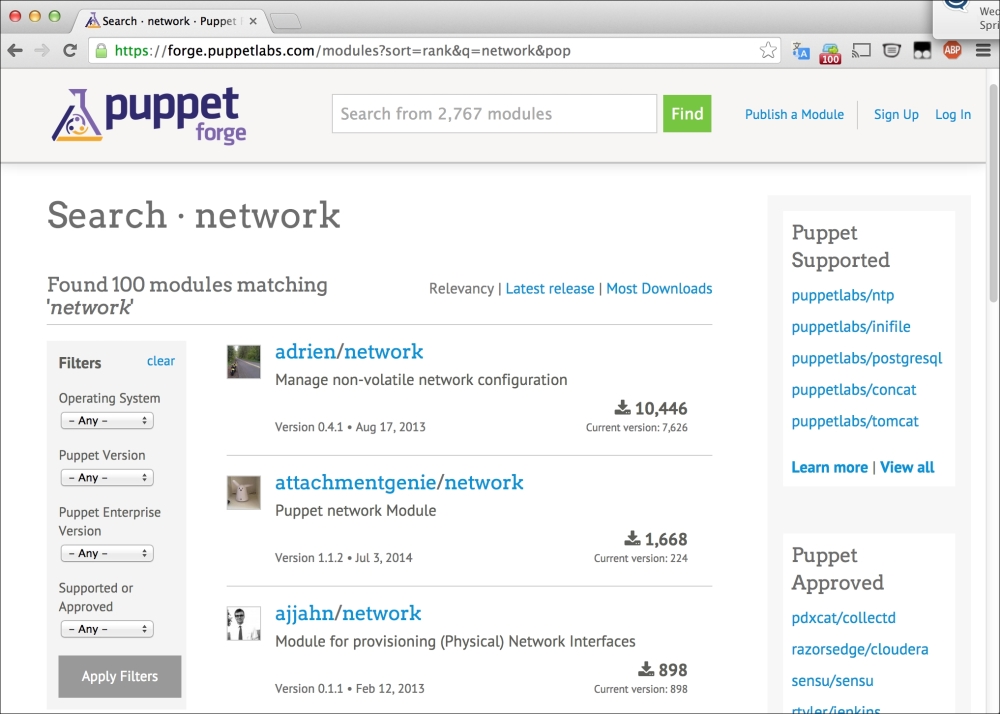
Before we can play with PuppetDB, we need to install it. Luckily, there's a handy Puppet module provided by Puppet Labs that can help us.
Go ahead and spin up your machine (refer to Chapter 1, Puppet as a Security Tool or Chapter 2, Tracking Changes to Objects if you need a refresher), and let's get PuppetDB installed so that we can explore it.
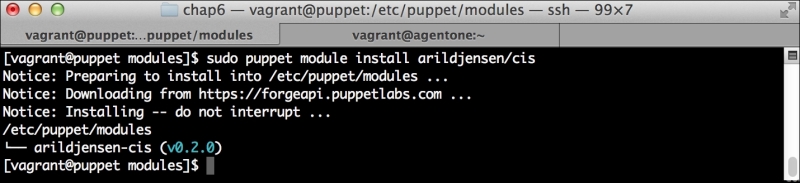
First, let's get the PuppetDB module installed. To do so, run the following command:
This will install the PuppetDB module, as well as several prerequisites we will need to run it. These include modules to manage PostgreSQL, and a number of utility modules. It'll also bring in a module to manage the local firewall. We'll use the same module in Chapter 7, Network Security and Puppet.
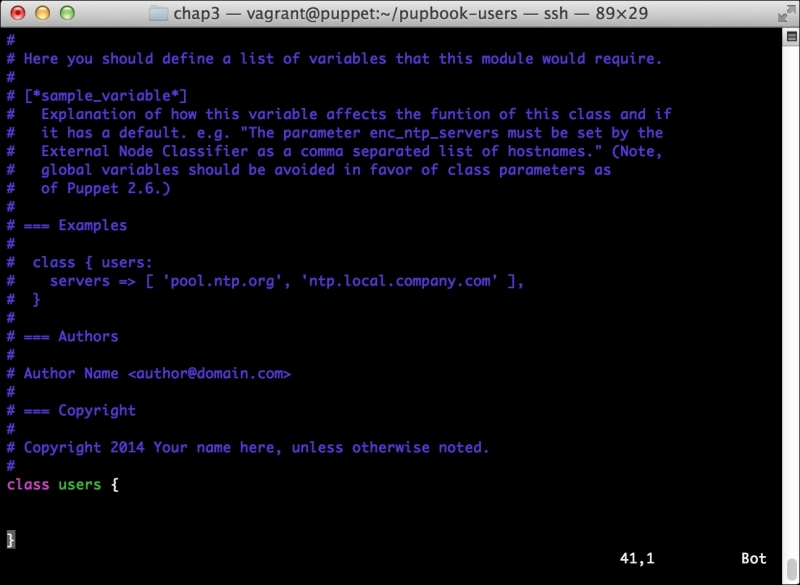
Now, we need to add the module to our manifest, so Puppet will install it (and even configure it) for us.
We'll use all of the defaults for a single host installation. since that is sufficient for our local testing. Let's edit our site.pp file in /etc/puppet/manifests and add lines so that it looks like the following:
We added the two include lines at the bottom. The first will install PuppetDB and all of its prerequisites, such as Java and PostgreSQL. The second will configure your Puppet Master to use PuppetDB.
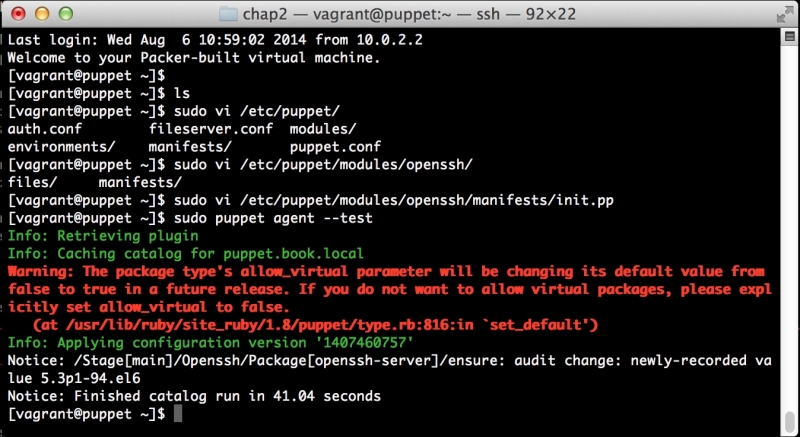
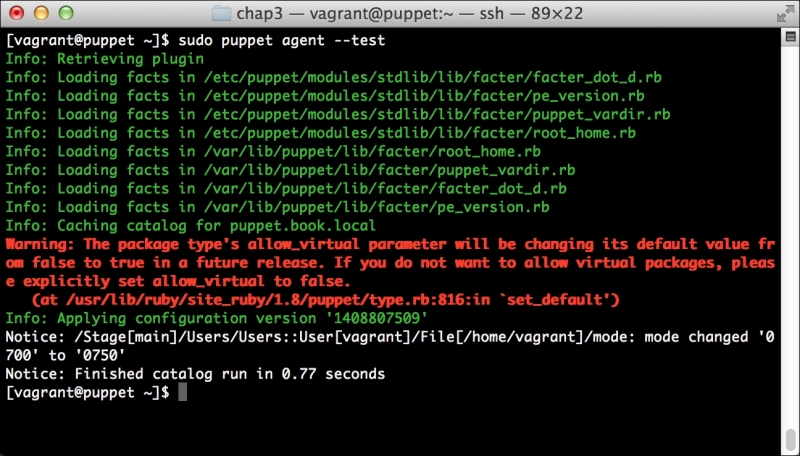
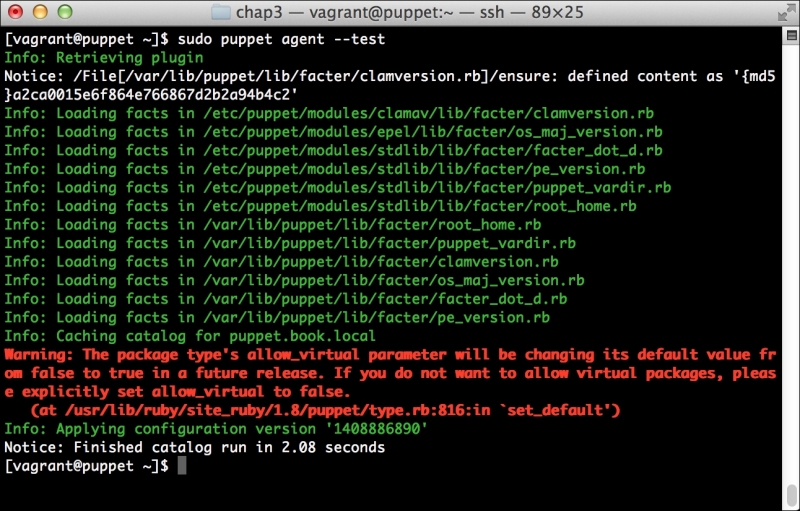
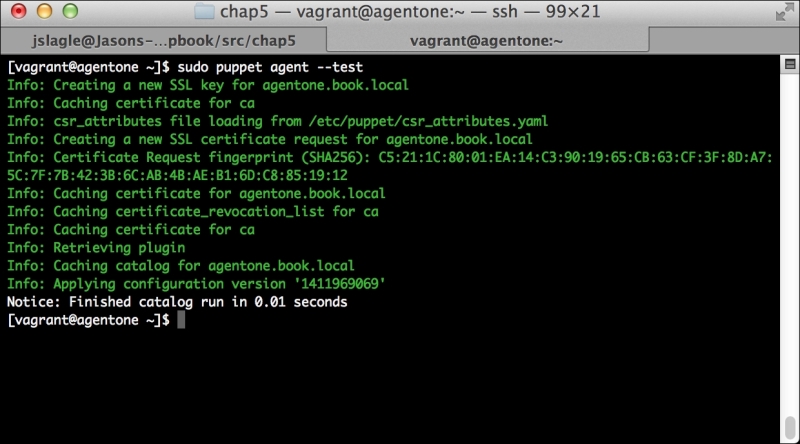
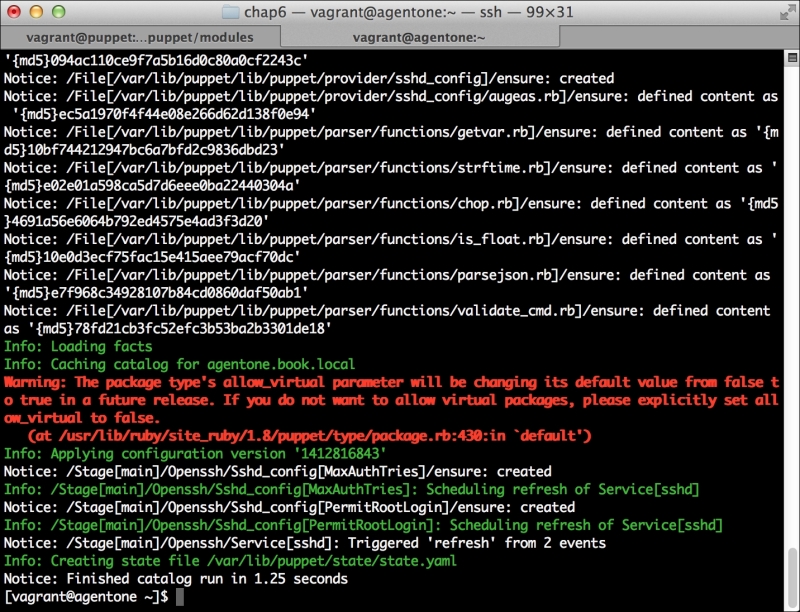
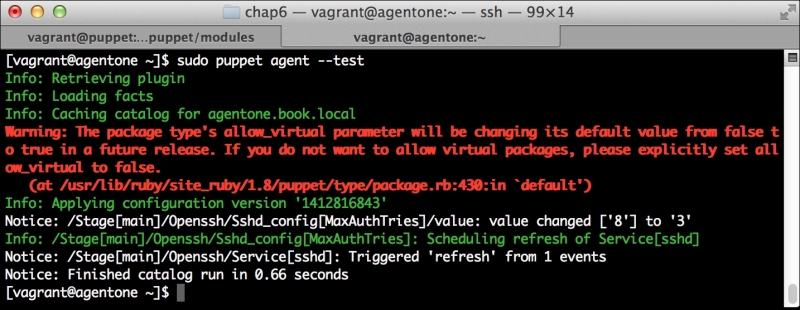
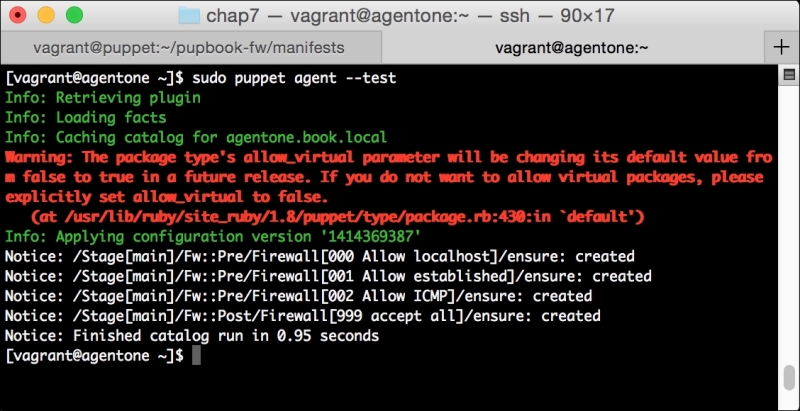
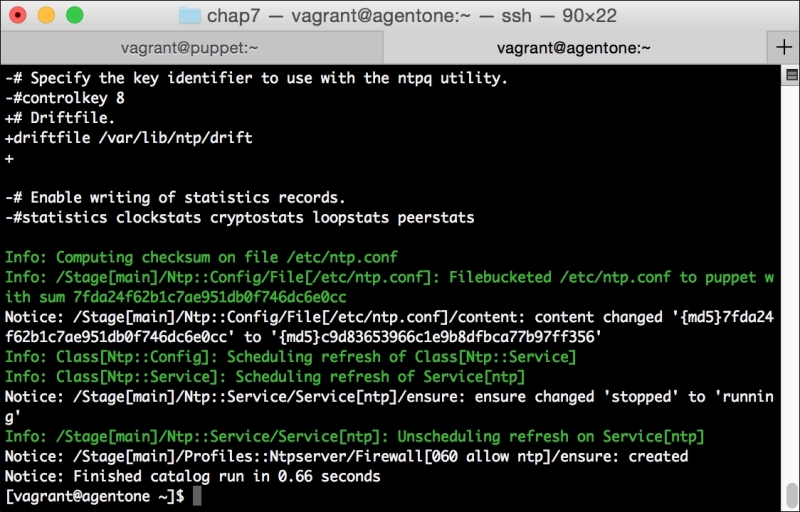
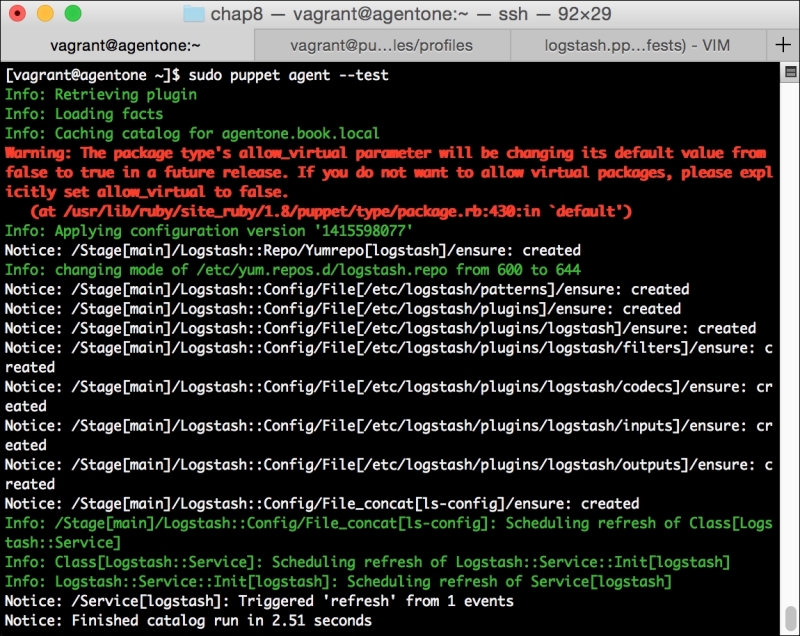
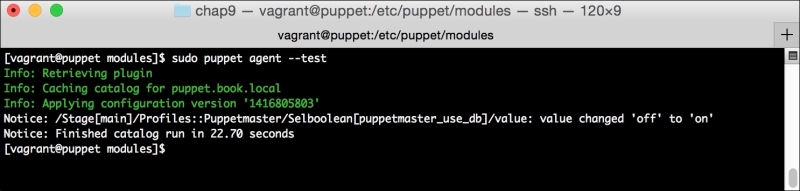
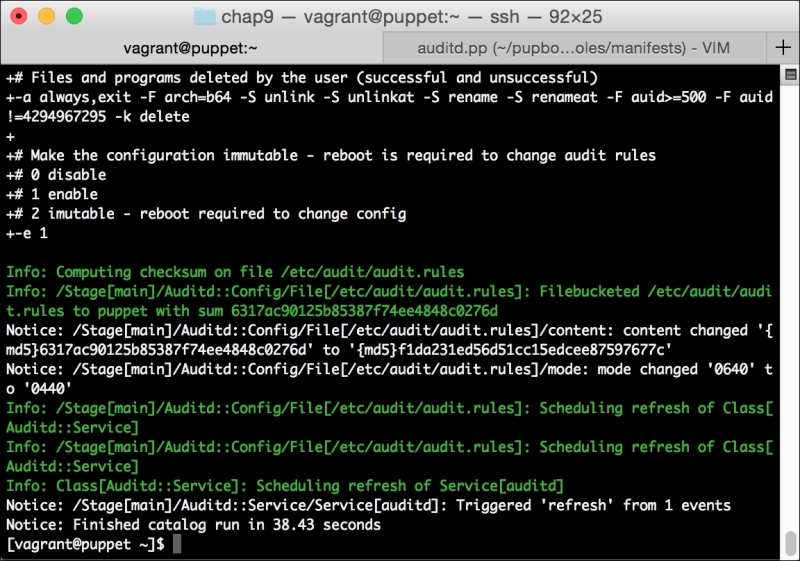
Now, let's run Puppet with our usual sudo puppet agent --test command. It will scroll a ton of stuff on your screen as it synchronizes the types and providers—copying the needed libraries to the client system. It'll then get to the meat of installing PuppetDB and configuring the master. In the end, it should give the output like the following:
We can notice that we receive a broken pipe error. This is due to the Puppet Master restarting during our run; hence, it is unavailable to receive the report. If you run Puppet again, you'll notice that it runs fine. However, if you're still running the user audit code from the last chapter, the users module tries to delete the PuppetDB and Postgres users. For now, we'll just remove this manifest by removing the line from the site.pp file. Edit /etc/puppet/manifests/site.pp and remove the include users line, as well as the include clamav line. Removing the clamav line is necessary because it uses our users module. You can also modify the module to handle the new users by either adding the user definition or adding the new users to the system user's parameter.
We need to make one last change. The PuppetDB module doesn't configure our master to store reports in PuppetDB, and we need this to do our work. We'll fix that now.
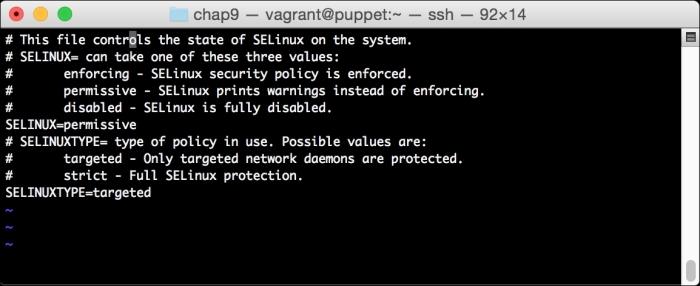
Edit the /etc/puppet/puppet.conf file. In this file, in the [master] section, find the line, as follows
Replace that line with the following:
Then, restart the puppetmaster service with the following command:
Once this is done and you run Puppet, it should run normally. In fact, you likely won't even notice that PuppetDB is there. However, it is there and it's waiting to assist you.
As was previously mentioned, PuppetDB uses a RESTful API for access. In a nutshell, that means we'll be making HTTP queries to get the report information.
To get that information, we'll need to use a query API. The query API supports a large number of endpoints, or URLs available to serve the information, and covering them all would quickly turn our book into an entire book on reporting, so we'll focus on specific ones to get some quick reports.
Let's go ahead and duplicate the information in the basic report in the last section via PuppetDB to show a basic report. We'll explore some additional endpoints later in this chapter.
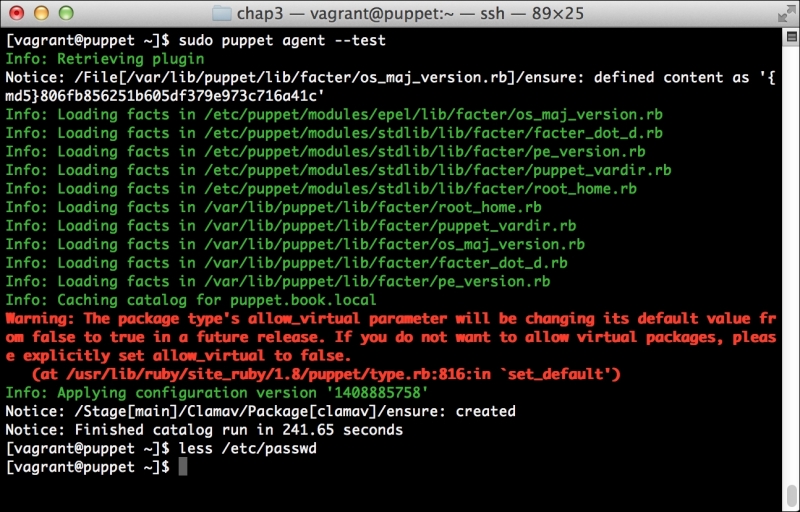
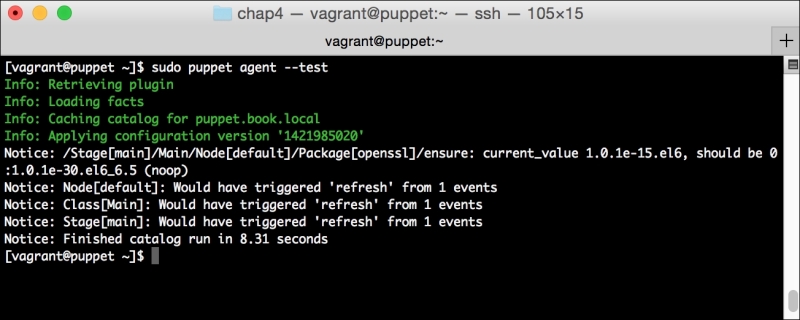
First, we need to get our interesting report into PuppetDB. To do that, we'll simply, manually remove the clamav package and let Puppet reinstall it. To do so, run the following commands:
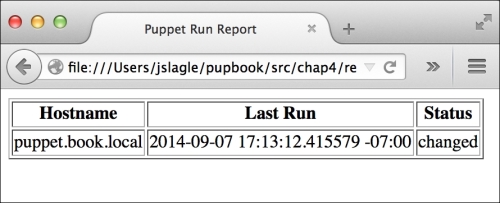
We should go ahead and create a report showing ClamAV being installed. This is similar to our earlier report.
Now, we'll use the report's endpoint to get information about the reports on a node. However, we'll want to approach this in a slightly different way than we did earlier.
First, we'll use the node's endpoint to get a list of nodes. We can do this on the command line using curl, as follows:
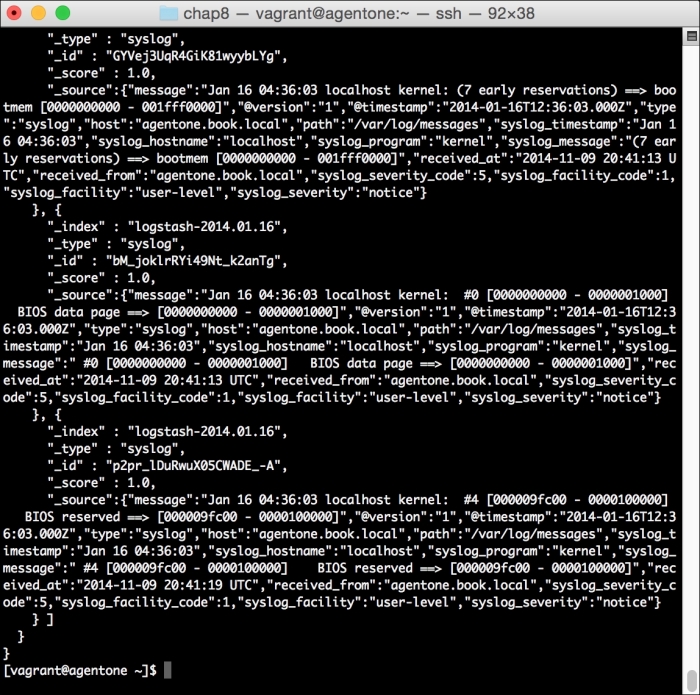
This will give the output similar to the following:
This output is in JSON. It's a bit harder to parse in bash, but we can use a helper library to assist us. This is present in EPEL, so we can install it as follows:
We can then use the jq program to process this JSON output in bash.
Tip
Why all this bash scripting?
In reality, you wouldn't likely use bash to do this work. While it's possible using tools, such as jq, we'd be better served with a more fully featured language. I have used bash here, since it's something most Linux admins will know offhand, and since the previous example is bash. There even exists helper libraries in languages, such as Ruby and Python to assist you with these reporting queries.
If we pipe the previous output to jq with a specially formatted query string, we can get the information we're after. The command is as follows:
The jq command will return the name tag of each of the elements of the array. This is the list of hostnames we care about.
Example – getting recent reports
For each hostname, we need to get the most recent report. To do this, we'll use the report's endpoint in PuppetDB and restrict it to the node we care about. This is a bit more complicated as a curl command, because we need to filter the data we are querying to just a single node.
We'll start by statically listing our host, and then we'll build the pieces into a script.
The command to do this is a doozy. We'll run the command and then break it into usable chunks:
Note
If your output is a blank set ([ ]), make sure you're reporting to PuppetDB, and that you've completed a run. See the previous section for details.
The preceding command should be on one single line.
We use a handful of PuppetDB arguments here. We pass these to curl with -data-urlencode and curl turns them into the POST or GET arguments, as needed. The first one, order-by, lets us order our output. In this case, we order by the end time of the run in a descending order.
The second argument is a query argument. There exists a very powerful set of operators available for use in the PuppetDB query language. A complete document explaining the syntax can be found at https://docs.puppetlabs.com/puppetdb/2.2/api/query/v3/query.html. In this case, what we're after is quite simple. We want the reports of a given host. In this case, our host would be, puppet.book.local.
The final argument is a limit. This simply limits the number of results we get back. In this case, we're limiting to 1.
Together, this will return the output like the following:
This returns a good amount of information on the run. Already, you can see that we have the start and end time of the run. As a matter of fact, the only data we're missing is the run status.
As it would turn out, PuppetDB doesn't actually store that status like a stored report does. There is currently a feature request in it to add this information to the PuppetDB backend. You can track that request at https://tickets.puppetlabs.com/browse/PDB-36.
PuppetDB instead stores the status of each individual event that happened on the node. We can use this information to display an even more useful summary in our example report.
Example – getting event counts
We'll now take a look at how we can use the individual event data to create reporting on aggregate event counts.
To do this, we'll use one final endpoint, the event-counts endpoint. This endpoint, as you might imagine, provides information on event counts from a run. We'll query it based on the hash of the report returned earlier. This will give us information on an individual run.
We need to summarize these events by some value. In this case, we can use the node certname since we're querying an individual report.
The command to get the information is as follows:
Once again, that is all on one line and be sure to use the hash of the report you ran in the previous section, or you will get no data.
It should return the results, as follows:
However, there's our information, even containing information on skipped resources (resources are skipped if a resource it depends on fails) and noop resources. If there was no report, or if there were no changed resources, you would receive an empty hash.
Example – a simple PuppetDB dashboard
We can use the information obtained to this point, in order to build a script such as our earlier one. The script will be somewhat more complicated but can report on more data. In the simplest case here, we'll report on the number of successful and failed resources, or simply return unchanged if no resources changed. If there are no changed resources, the preceding event counts will return null.
The script to do this is as follows:
I've noted the wrapped lines with \ at the end.
As you can see, the shell of the script is very similar to what we found earlier. However, the main loop has changed. In this case, we build a list of hosts by querying the node's endpoint. We then take this list and gather information about each using first, the report's endpoint and then, the event-count's endpoint. We use some jq magic to format it, and then finally we output the information line.
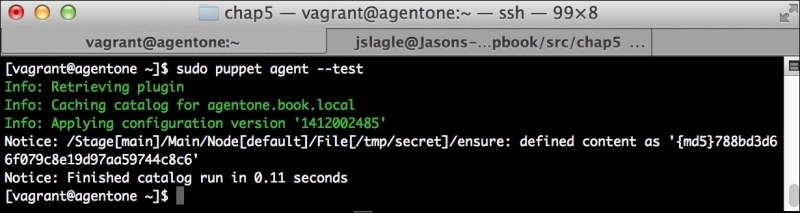
The output to this command, when run, is very similar to the earlier output, with the addition of the number of successful or failed resources when ran. The output is shown in the following screenshot:
As you can see, PuppetDB provides a very powerful base to report from. We've not even scratched the surface of what's possible. We'll take a look at some other things we can do next.